Download
1 / 18
180 likes | 201 Views
Explore the validation process of CRR values with radar data through convective episodes, using visual and objective techniques. Comparison of accuracy and categorical statistics.

E N D
Validation for CRR (PGE05) NWC SAF PAR Workshop 17-19 October 2005 Madrid, Spain A. Rodríguez
Contents of presentation • General validation objectives for CRR product • Summary description of the validation process • Example of visual validation. General case study • Example of visual validation . Usefulness on non-radar coverage areas • Example of visual validation. 3D vs. 2D calibration behaviour • Visual validation. Summary • Results of accuracy statistics: ME, MAE, RMSE • Results of categorical statistics: FAR, POD, CSI, PC • Objective validation. Summary • Planned activities
General Validation Objectives for CRR product The goal of this presentation is to compare visual and objectively the CRR values obtained from SEVIRI data with the radar information considered as the “truth data”. For this purpose convective episodes from the 01/06/05 to the 07/09/05 have been selected. The datasets used for this validation are the following: • CRR values from MSG SEVIRI SPAIN region (SAFNWC software package version v1.2) • Composite Radar imagery from the Spanish National Radar Centre: Echotop and Rainfall Rate (RFR) from PPI (at about 2Km of resolution). • IR10.8 SEVIRI imagery (at full resolution). The geographical area to match the Spanish radar area is about 1500x1500 Km centred in 40N 3W. • I.N.M Lightning data base (LDB) (Only visual validation) List of days (up to 26) used in this validation, in Julian date: 152,161,162,163,169,170,171,172,173,174,178,179,185,208,209,212,213,214,220,222,223,228,229,230, 232,250
General Validation Objectives for CRR product • All the corrections with the default values have been applied. The fields for the moisture and orographic corrections have been extracted from ECMWF at0.5 x 0.5 degree spatial resolution, every 6h. • McIDAS software has been used in order to obtain the collocated datasets and to generate the objective validation process. • The visual validation has been performed by displaying, analyzing and comparing the products in an interactive manner by using also the McIDAS environment.
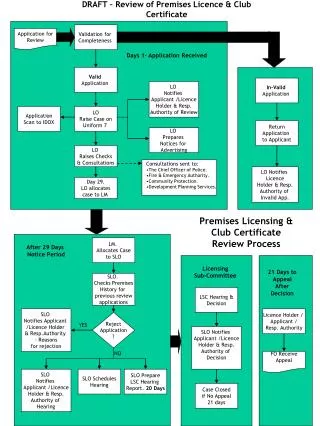
Summary description of the objective validation process • Image projection: Radar images have been re-projected to the satellite projection. • Ground echoes detection: A rain image has been obtained from the IR10.8 data using the basic AUTOESTIMATOR algorithm (Vicente, G.A. et al, 1998). A pixel with significant radar echo is considered to be a ground echo and set to zero if no significant value is found in a 15x15 centred box in the AUTOESTIMATOR image. • Potential convective pixels detection: When in the ECHOTOP image the ratio between the number of echoes greater than 6 Km and the ones greater than 0 Km is lower than 1% the Radarimages are rejected. • Convective image: A filtered Radar image has been obtained to choose the area of validation. The pixels in the RFR image are set to zero if all the nearest pixels in a 11x11 grid centred on the pixel do not reach a top of 6 Km in the ECHOTOP image and a rainfall rate of 3 mm/hr in the RFR image. • Then the Radar rainratedata contained in the convective image have been matched pixel by pixel with the CRR data and accuracy and categorical statistics have been calculated for all the selected case studies. • The CRR>0 classes have been assigned to the rainfall rate corresponding to the center of the class to compare the radar information (mm/hr) with the CRR values. CRR=0 has been assigned to 0 mm/hr.
Example of visual validation (01/08/2005 at 17:00 UTC). General case study. Comparison of CRR image (top left), Convective radar image (top right), INM lightning data (bottom left) and RFR radar image (bottom right) on 1 August 2005 at 17:00 UTC
Example of visual validation (20/08/2005 at 13:00 UTC) . Usefulness on non-radar coverage areas Comparison of CRR image (top left), Convective radar image (top right), INM lightning data (bottom left) and RFR radar image (bottom right) on 20 August 2005 at 13:00 UTC
Example of visual validation. (17/08/2005 at 18:00 UTC). 3D vs. 2D calibration behaviour Comparison of CRR image (top left), Convective radar image (top right), INM lightning data (bottom left) and RFR radar image (bottom right) on 17 August 2005 at 18:00 UTC
Example of visual validation. (17/08/2005 at 18:30 UTC). 3D vs. 2D calibration behaviour Comparison of CRR image (top left), Convective radar image (top right), INM lightning data (bottom left) and RFR radar image (bottom right) on 17 August 2005 at 18:30 UTC
Visual validation. Summary • The convective area chosen for the objective validation is well supported by the lightning data. • The CRR data are in general also well supported by the lightning data. • In some cases CRR=0 when the radarshowsprecipitation and there is also presence of lightning data. Behaviour associated with warmer tops, mainly using 2-D calibration. • In some cases CRR gives rain where radar doesn't. • The CRR generally underestimates the rainfall rate and sometimes overestimates the area of precipitation. High values of radar rainfall rate are not reached by CRR. • The CRR behaviour is better on well developed convection associated with the colder tops. The area of CRR precipitation corresponds mainly to the higher echoes in the ECHOTOP image. • The product is useful on non-radar coverage areas. • Better behaviour when using solar channel. Some areas of precipitation detected with the solar channel are lost when using 2-D cal.
Accuracy statistics. 3D vs. 2D Statistics affected for a high number of pixels with no rain in both sources in the validation area :409009(3D), 133749(2D) • MEAN and MAE quite similar. • ME: general underestimation. Better results using solar channel (3D). • RMSE slightly greater using 3-D cal.
Categorical Statistics. Contingency Tables • Five contingency tables have been obtained using five rainfall ratethresholds: 0, 1, 3, 5 and 7 mm/h. Yes event means the rain rate (estimated or observed) is greater than the threshold. No event means the rain rate (estimated or observed) is not greater than the threshold. • Categorical statistics: False Alarm Ratio FAR = [FA/(H+FA)] Probability of Detection POD = [H/(H+M)] Critical Success Index CSI = [H/(H+M+FA)] Percentage of Corrects PC = [(H+CN)/(H+M+FA+CN)]
Categorical Statistics. 3D Number of pixels processed: 837505
Categorical Statistics. 2D Number of pixels processed: 312348
Categorical Statistics. 3D vs. 2D: FAR, POD • FAR is quite similar in both calibrations. Slightly higher when using 2D cal. for rates greater than 3 mm/hr. • POD is always better when using 3D cal. Slightly higher detecting rates greater than 1mm/hr.
Categorical Statistics. 3D vs. 2D: CSI, PC • CSI is always better when using 3D cal. • PC slightly higher when using 3D cal.
Objective validation. Summary • Better results in general using the solar channel (3D). • General underestimation of the algorithm. No CRR estimated rainfall rate greater than 20 mm/hr on this study. Many cases on Radar rates. • The probability of detection if the observed rates overcomes a threshold is better for the low ones. The false alarm ratio and the critical success index have also better values in these cases. • The value of these scores are very poor because the pixels with precipitation in both (CRR and Radar) images doesn't matched very well geographically. CRR based on cloud top measurements Vs. the radar first elevation data. • The percentage of corrects have better values because includes the correct negatives whichare greater for high thresholds. • Better results are expected if using an instantaneous validation by grouping pixels in lat/lon boxes or working with accumulations.
Planned activities • To use other methods of validation: Validate instantaneous rainrates using lat/lon boxes Validate rainfall accumulations • Study the impact of applying or not the corrections on the validation result. • Calibration based on mm/hr instead of classes in order not to lose information on basic and corrected CRR values. • Study the Impact of using of other channels