Revitalizing High School Computer Science in California: Opportunities and Challenges
This report delves into the current state and future prospects of high school computer science education in California, highlighting the immense potential for job growth in the field. Despite the high demand for computing professionals in the state, a significant gap exists in the number of students pursuing computer science education. The report sheds light on strategies to attract a more diverse student population to the field, emphasizing the importance of early exposure and innovative curricula. Furthermore, it discusses initiatives such as the California Computing Education Advocacy Network (CCEAN) and new curricula like Exploring CS and CS Principles that aim to enhance computer science education at the K-12 level. By addressing key challenges and seizing opportunities, California can foster a new generation of skilled professionals prepared to meet the demands of the digital age.

Revitalizing High School Computer Science in California: Opportunities and Challenges
E N D
Presentation Transcript
Revitalizing High School Computer Science Dan LewisSanta Clara University
California’s 2009 Exports California’s leading export category in 2009 was computers and electronics products $35 billion(29%) Source: http://business.ca.gov/WhyCA/TheCaliforniaEconomy.aspx
Employment Projections 60% Computer Science will generate more job growth between now and 2018 than all other STEM fields combined. Californiawill have an average of more than 20,000 job openings in computing each year for the next five years. Source: http://www.ncwit.org/caucus.php?id=CA 13.4% 5.6% 3.1% Source: U.S. Department of Labor Bureau of Labor Statistics, 2008.
Openings vs. Graduates Number of computer specialist job openings expected in U.S. by 2018 • 1.4 million Percentage of these that could possibly be filled by U.S. computing graduates 29% Only 2% of ACT-tested 2010 high school graduates indicated a career interest in computing. Sources: NCWIT (2009). Women and Information Technology By the Numbers, and ACT Research, The Condition of Career and College Readiness: 2010
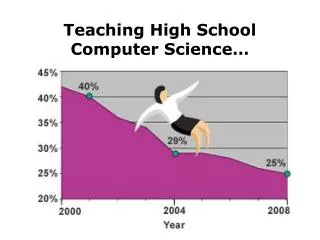
National Enrollments 7.6% • HS students who enroll in an Intro CS class • HS students who enroll in AP CS class (offered in less than 10% of schools) • Failing to attract women, racial minorities and the economically disadvantaged. 32% women 68% men 2.1% 17% women 83% men Source: http://csta.acm.org/Research/sub/Projects/ResearchFiles/CSTASurvey07CSDCResults.pdf
California Enrollments Source: Compiled by Lloyd McCabe of CDE based on Data Quest data
2010 California AP Test Takers Source: http://www.collegeboard.com/student/testing/ap/exgrd_sum/2010.html California has one of the lowest CS AP participation rates among all U.S. high school students
AP Test Takers: CS as % of Math Dallas, Texas 26% Silicon Valley 10% Source: http://www.ncwit.org/work.campaigns.cse.html
Taking Action California Computing Education Advocacy Network (CCEAN)
New Curricula Exploring CS http://exploringcs.org • Entry level course for grades 9 or 10 • Prerequisite: Algebra • Funded by NSF • First taught in 2009-10 in LAUSD CS Principles http://csprinciples.org • Second level course • Supported by NSF, College Board, CSTA • Piloted in 2010-11 • Designed to be an AP course New K-12 CS Curriculum Guidelines http://csta.acm.org/includes/Other/CSTAStandardsReview2011.pdf