1 / 1
Supplementary Figure 1
10 likes | 205 Views
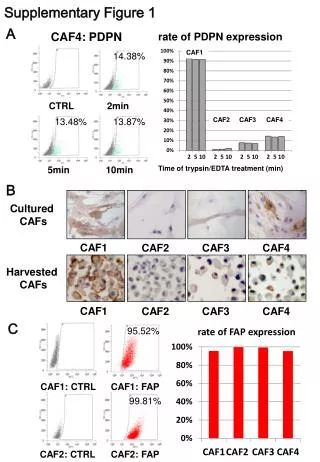
Supplementary Figure 1. A. rate of PDPN expression. CAF4: PDPN. 13.48%. 14.38%. CAF1. Time of trypsin/EDTA treatment (min). B. Cultured CAFs. CTRL. 2min. 13.87%. CAF2. CAF3. CAF4. CAF1. CAF3. CAF4. CAF2. Harvested CAFs. 5min. 10min. CAF1. CAF3. CAF4. CAF2. C.
Download Presentation
Supplementary Figure 1
An Image/Link below is provided (as is) to download presentation
Download Policy: Content on the Website is provided to you AS IS for your information and personal use and may not be sold / licensed / shared on other websites without getting consent from its author.
Content is provided to you AS IS for your information and personal use only.
Download presentation by click this link.
While downloading, if for some reason you are not able to download a presentation, the publisher may have deleted the file from their server.
During download, if you can't get a presentation, the file might be deleted by the publisher.
E N D
Presentation Transcript
Supplementary Figure 1 A rate of PDPN expression CAF4: PDPN 13.48% 14.38% CAF1 Time of trypsin/EDTA treatment (min) B Cultured CAFs CTRL 2min 13.87% CAF2 CAF3 CAF4 CAF1 CAF3 CAF4 CAF2 Harvested CAFs 5min 10min CAF1 CAF3 CAF4 CAF2 C 95.52% CAF1: CTRL CAF1: FAP 99.81% CAF2: CTRL CAF2: FAP
More Related