Download
1 / 2
20 likes | 483 Views
Spanking and Corporal Punishment Research Paper SOWK 300 Computer Applications in the Social Sciences Spring 2012 Gabrielle Ferioli 01 MW and Number. Conclusions. Introduction. Discussion.

E N D
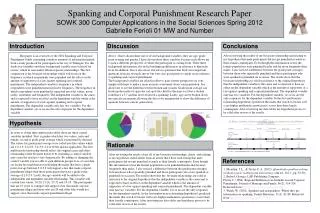
Spanking and Corporal Punishment Research Paper SOWK 300 Computer Applications in the Social Sciences Spring 2012 Gabrielle Ferioli 01 MW and Number Conclusions Introduction Discussion After reviewing the results of my bivariate relationship and relating to my hypothesis that male participants did not get punished as much as their female counterparts. Even though this information is true the female populations were punished harder and far more frequently than males. I also noticed a difference between the grade point averages between those who repeatedly punished and those participants who were spanked or punished on occasion. The results show that the bivariate relationship are valid in reference to the original hypothesis that the independent variable is the cause and is expected to have an effect on the dependent variable which is the amount of supporters of a law against spanking and corporal punishment. The dependent variable only has two variables. For the dependent variable, yes or no are the only responses for the dependent variable. In the first multivariate relationship hypothesis I predicted the males that watch 0-2 hours will score higher mathematics proficiency scores than their female counterparts. After reviewing my data tables my hypothesis proves to be valid after review of the results. Above I have chosen three out of seven background variables, they are age, grade point average and gender. I have chosen these three variables because each allows me to gain a different perspective of where the participant is coming from. These three background information also aid in breaking up differences in reference to hierarchy level. In addition, I have also chose five survey questions that I felt were important questions from my research survey but were also good points to speak on in reference to spanking and corporal punishment. The background variables are asked in effort to gain a better perspective on your sample with hope to make a more accurate assessment about your population. Sex allows me to see the differences between men and women. Grade point average can break up the myths of spare the rod spoil the child for the mere fact that a student could have a 3.7 and has never received a spanking. Lastly, age can be broken down into specific increments allowing the data to be manipulated to show the difference of opinions between various generations. This paper is an overview of the 2012 Spanking and Corporal Punishment Study containing countless amounts of information gained from a study produced for participants in the city of Tuskegee. For this study five variables and three background variable were selected for review, which in sum makes fifteen separate relationships. The first comparison is the bivariate relationship which will focus on the frequency in which respondents were punished and the effect on the amount of supporters of a law against spanking and corporal punishment. The independent variable is frequency in which respondents were punished measured in by frequency. The frequency in which respondents were punished is separated into four values, never, rarely, sometimes and frequently. The independent variable is the cause and is expected to have an effect on the dependent variable which is the amount of supporters of a law against spanking and corporal punishment. The dependent variable only has two variables. For the dependent variable, yes or no are the only responses for the dependent variable. CHART or PICTURE Hypothesis In order to obtain three multivariate tables there are three control variables included. First is gender which has two values, male and female; second is grade point average which is measured by decimal. The values for grade point average were coded into five values which are 1.0-1.9, 2.0-2.9, 3.0-3.9, 4.0 or better and not applicable. The first multivariate relationship should reflect the original cause and effect relationship of the bivariate however by including a control variable may cause the results to vary dramatically. By adding or changing the control variable you are able to gain different perspectives of your data set. In the first multivariate relationship the males that have a grade point average between 3.0-3.9 will support a law that made corporal punishment illegal than those participants that have a grade point average of 2.0-2.9. Lastly, the age variable will be added to the independent and dependent variable relationship. This variable will contain four values, 18-20, 21-26, 27-32 and 33-35. The participants that are 23 years or younger will support a law that made corporal punishment illegal and those who are 24 and older who would not support a law that made corporal punishment illegal. Rationale After reviewing the results of my all of my bivariate relationships, charts and relating to my hypothesis stated earlier from an article that I have read stating that male participants did not get punished as much as their female counterparts. Even though this information is true the female populations were punished harder and far more frequently than males. I also noticed a difference between the grade point averages between those who repeatedly punished and those participants who were spanked or punished on occasion. The results show that the bivariate relationship are valid in reference to the original hypothesis that the independent variable is the cause and is expected to have an effect on the dependent variable which is the amount of supporters of a law against spanking and corporal punishment. The dependent variable only has two variables. For the dependent variable, yes or no are the only responses for the dependent variable. In the first multivariate relationship hypothesis I predicted the males that watch 0-2 hours will score higher mathematics proficiency scores than their female counterparts. After reviewing my data tables my hypothesis proves to be valid after review of the results. References • 1. Mcarthur, J. L., & Taylor, F. A. (2012). Quantitative problem solving methods course readings and instructions. (4th ed., Vol. 1, pp. 50-58). 2. Buford, Georgia: LAD Publishing Company. • Flynn, C. (1994). Regional Differences in Attitudes toward Corporal Punishment. Journal of Marriage and Family, 56(2), 314-324. Retrieved from http://www.jstor.org/stable/353102 • 3. Walsh, W. (2002). Spankers and nonspankers: Where they get information on spanking. Family Relations, 51(1), 81-88. Retrieved from http://www.jstor.org/stable/3700302
Project SOWK 300 Computer Applications in the Social Sciences Spring 2010 Student Name Section Day and Number LOGO LOGO Conclusions Section Section Xxxxxxxxxxxxxxxxxxxxxxxxxxxxxxxxxxxxxxxxxxxxxxxxxxxxxxxxxxxxxxxxxxxxxxxxxxxxxxxxxxxxxxxxxxxxxxxxxxxxxxxxxxxxxxxxxxxxxxxxxxxxxxxxxxxxxxxxxxxxxxxxxxxxxxxxxxxxxxxxxxxxxxxxxxxxxxxxxxxxxxxxxxxxxxxxxxxxxxxxxxxxxxxxxxxxxxxxxxxxxxxxxxxx Xxxxxxxxxxxxxxxxxxxxxxxxxxxxxxxxxxxxxxxxxxxxxxxxxxxxxxxxxxxxxxxxxxxxxxxxxxxxxxxxxxxxxxxxxxxxxxxxxxxxxxxxxxxxxxxxxxxxxxxxxxxxxxxxxxxxxxxxxxxxxxxxxxxxxxxxxxxxxxxxxxxxxxxxxxxxxxxxxxxxxxxxxxxxxxxxxxxxxxxxxxxxxxxxxxxxxxxxxxxxxxxxxxxx Xxxxxxxxxxxxxxxxxxxxxxxxxxxxxxxxxxxxxxxxxxxxxxxxxxxxxxxxxxxxxxxxxxxxxxxxxxxxxxxxxxxxxxxxxxxxxxxxxxxxxxxxxxxxxxxxxxxxxxxxxxxxxxxxxxxxxxxxxxxxxxxxxxxxxxxxxxxxxxxxxxxxxxxxxxxxxxxxxxxxxxxxxxxxxxxxxxxxxxxxxxxxxxxxxxxxxxxxxxxxxxxxxxxx Xxxxxxxxxxxxxxxxxxxxxxxxxxxxxxxxxxxxxxxxxxxxxxxxxxxxxxxxxxxxxxxxxxxxxxxxxxxxxxxxxxxxxxxxxxxxxxxxxxxxxxxxxxxxxxxxxxxxxxxxxxxxxxxxxxxxxxxxxxxxxxxxxxxxxxxxxxxxxxxxxxxxxxxxxxxxxxxxxxxxxxxxxxxxxxxxxxxxxxxxxxxxxxxxxxxxxxxxxxxxxxxxxxxx • Xxxxxxxxxxxxxxxxxxxxxxxxxxxxxxxxxxxxxxxxxxxxxxxxxxxxxxxxxxxxxxxxxxxxxxxxxxxxxxxxxxxxxxxxxxxxxxxxxxxxxxxxxxxxxxxxxxxxxxxxxxxxxxxxxxxxxxxxxxxxxxxxxxxxxxxxxxxxxxxxxxxxxxxxxxxxxxxxxx • Xxxxxxxxxxxxxxx • xxxxxxxxxxxxxxxxxxxxxxxxxxxxxxxxxxxxxxxxxxxxxxxxxxxxxxxxxxx • xxxxxxxxxxxxxxxxxxxxxxxxxxxxxxxxxxxxxxxxxxxxxxxxxxxxxxxxxxx • xxxxxxxxxxxxxxxxxxxxxxxxxxxxxxxxxxxxxxxxxxxxxxxxxxxxxxxxxxx Xxxxxxxxxxxxxxxx • xxxxxxxxxxxxxxxxxxxxxxxxxxxxxxxxxxxxxxxxxxxxxxxxxxxxxxxxxxx • xxxxxxxxxxxxxxxxxxxxxxxxxxxxxxxxxxxxxxxxxxxxxxxxxxxxxxxxxxx • xxxxxxxxxxxxxxxxxxxxxxxxxxxxxxxxxxxxxxxxxxxxxxxxxxxxxxxxxxx • This poster template is provided as a guide. You may NOT change the layout/look of your poster, but add text, charts, graphs and text boxes as needed. Remove the instructions contained in this document before you begin typing - print them to refer to them. Proof your work before having it professionally printed. If it looks poor to you it will probably print poorly as well. • POSTER Guidelines • Font is either Arial or Helvetica • Headings should be 48pt or larger • Text should be 36pt or larger • The smallest text size in figures and tables should be 24pt or larger • Paper Title should be 72pt font • Delete these instructions and replace with text from your paper. CHART or PICTURE CHART or PICTURE CHART or PICTURE Section • Xxxxxxxxxxxxxxxxxxxxxxxxxxxxxxxxxxxxxxxxxxxxxxxxxxxxxxxxxxxxxxxxxxxxxxxxxxxxxxxxxxxxxxxxxxxxxxxxxxxxxxxxxxxxxxxxxxxxxxxxxxxxxxxxxxxxxxxxxxxxxxxxxxxxxxxxxxxxxxxxxxxxxxxxxxxxxxxxxxxxxxxxxxxxxxxxxxxxxxxxxxxxxxxxxxxx • Xxxxxxxxxxxxxxx • xxxxxxxxxxxxxxxxxxxxxxxxxxxxxxxxxxxxxxxxxxxxxxxxxxxxxx • xxxxxxxxxxxxxxxxxxxxxxxxxxxxxxxxxxxxxxxxxxxxxxxxxxxxxxxxxxx • xxxxxxxxxxxxxxxxxxxxxxxxxxxxxxxxxxxxxxxxxxxxxxxxxxxxxxxxxxx • xxxxxxxxxxxxxxxxxxxxxxxxxxxxxxxxxxxxxxxxxxxxxxxxxxxxxxxxxxx Xxxxxxxxxxxxxxxx • xxxxxxxxxxxxxxxxxxxxxxxxxxxxxxxxxxxxxxxxxxxxxxxxxxxxxxxxxxx • xxxxxxxxxxxxxxxxxxxxxxxxxxxxxxxxxxxxxxxxxxxxxxxxxxxxxxxxxxx • xxxxxxxxxxxxxxxxxxxxxxxxxxxxxxxxxxxxxxxxxxxxxxxxxxxxxxxxxxx CHART or PICTURE CHART or PICTURE Figure_1.bxxxxxxxxxxxxxxxxx Figure_1cxxxxxxxxxxxxxxxxxxxx Figure_1.axxxxxxxxxxxxxxxxxxxxx Section • Xxxxxxxxxxxxxxxxxxxxxxxxxxxxxxxxxxxxxxxxxxxxxxxxxxxxxxxxxxxxxxxxxxxxxxxxxxxxxxxxxxxxxxxxxxxxxxxxxxxxxxxxxxxxxxxxxxxxxxxxxxxxx • Xxxxxxxxxxxxxxx • xxxxxxxxxxxxxxxxxxxxxxxxxxxxxxxxxxxxxxxxxxxxxxxxxxxxx • xxxxxxxxxxxxxxxxxxxxxxxxxxxxxxxxxxxxxxxxxxxxxxxxxxxxx • xxxxxxxxxxxxxxxxxxxxxxxxxxxxxxxxxxxxxxxxxxxxxxxxxxxxx • xxxxxxxxxxxxxxxxxxxxxxxxxxxxxxxxxxxxxxxxxxxxxxxxxxxxx Xxxxxxxxxxxxxxxx • xxxxxxxxxxxxxxxxxxxxxxxxxxxxxxxxxxxxxxxxxxxxxxxxxxxxx • xxxxxxxxxxxxxxxxxxxxxxxxxxxxxxxxxxxxxxxxxxxxxxxxxxxxx • xxxxxxxxxxxxxxxxxxxxxxxxxxxxxxxxxxxxxxxxxxxxxxxxxxxxx References • Xxxxxxxxxxxxxxxxxxxxxxxxxxxxxxxxxxxxxxxxxxxxxxxxxxxxxx • Xxxxxxxxxxxxxxxxxxxxxxxxxxxxxxxxxxxxxxxx • Xxxxxxxxxxxxxxxxxxxxxxxxxxxxxxxxxxxxxxxxxxxxxxxxxxxxxxxxxxxxxxxxxxxxxxxxxxxxxxxxxxxxxxxxxxxxxxxxx • Xxxxxxxxxxxxxxxxxxxxxxxxxxxxxxxxxxxxxx • Xxxxxxxxxxxxxxxxxxxxxxxxxxxxxxxxxxxxxxxxxxxxxxxxxxxxxxxxxxxxxxxxxxxxxxxxxxxxxxxxxxxxxxxxxxxxxxxxxxxxx