Download
1 / 28
290 likes | 490 Views
EEG-based Machine Learning Methods for Applications in Psychiatry. Jim Reilly Gary Hasey Hubert de Bruin Ahmad Khodayari-R Duncan MacCrimmon. ON Semiconductor, April 11, 2011. This is a team effort!. Our research team: Gary M. Hasey Ahmad Khodayari-R. James P. (Jim) Reilly

E N D
EEG-based Machine Learning Methods for Applications in Psychiatry Jim Reilly Gary Hasey Hubert de Bruin Ahmad Khodayari-R Duncan MacCrimmon ON Semiconductor, April 11, 2011
This is a team effort! Our research team: Gary M. Hasey Ahmad Khodayari-R. James P. (Jim) Reilly Hubert de Bruin Duncan MacCrimmon Cathy Ivanski Rose Marie Mueller Jackie Heaslip Sandra Chalmers Joy Fournier Margarita Criollo Eleanor Bard … Thanks to all nurses and staff who helped doing the clinical experiments!
Outline • Subject: Machine learning (ML) for prediction of response to psychiatric therapy • Motivation • Overview of ML techniques • Feature extraction • Feature selection/reduction • Classification • Validation • Results • Commercial Potential
MAJOR DEPRESSIVE DISORDER 2nd LARGEST CAUSE OF WORK PLACE DISABILITY ages 15-44 • 37,076,000 on Antidepressant drugs in US, Can, EU, Australia • 3rd largest class of pharmaceuticals world-wide • Most commonly prescribed class of drugs in USA • >1/3 female office visits in USA involved antidepressant drug (ADD) • Use increased by 75% from 1996 to 2005 (Center for Disease Control) • 5.8 % Canadians and 10.1% of Americans are on ADD • 68% of ADD prescribed by Family MD http://seekingalpha.com/article/22433-antidepressant-drug-market-new-fda-warning-to-have-limited-impact Washington Post December 3, 2004; Page A15 http://www.cnn.com/2007/HEALTH/07/09/antidepressants/index.html http://psychcentral.com/news/2009/08/03/antidepressant-use-up-75-percent/7514.html
The current “State of the Art” for antidepressant drug selection Random selection ? Keep trying until one fits
STAR*D Study (Sequential Treatment Achieve Remission of Depression) How Effective Is the “State of the Art”? ✓ ✗✗ 1st choice is wrong in 2 of 3 patients Warden, D., et al., The STAR*D Project results: a comprehensive review of findings. Curr Psychiatry Rep, 2007. 9(6): p. 449-59.
COST OF ACHIEVING REMISSION If Initial treatment works1 : $ 3,600 If initial treatment fails2 : $16,000 1) Baker, C. B. and S. W. Woods (2001). "Cost of treatment failure for major depression: direct costs of continued treatment." Administration and policy in mental health28(4): 263-277 (1995 costs quoted adjusted for inflation). 2) Malone, D. C. (2007). "A budget-impact and cost-effectiveness model for second-line treatment of major depression." J Manag Care Pharm13(6 Suppl A): S8-18.
How We Propose to Fix This Problem --- 2. Collect pre-treatment QEEG 1. Establish Diagnosis 3. Treat : SSRI, rTMS or Clozaril MarketedService confirmsdiagnosis recommends specific treatment 6. Test predictive accuracy using “leave N out” or an independent sample self improving feedback loop 4. Measure treatment response 5. Use response data, diagnosis & QEEG to train computer
Overview of the Prediction Procedure 22 Subjects were prescribed SSRI medication after pre-treatment EEG • Response (R or NR) is recorded 6 weeks after onset of treatment. • Responder is defined as 25% improvement in Hamilton Depression Rating Score • Training Data: consists of subject EEG data and corresponding response value
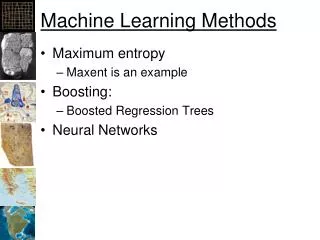
Machine Learning Method • Steps of the prediction procedure: 1. Extraction of features from the EEG 2. Feature selection /dimensionality reduction 3. Design of the predictor using a classifier 4. Performance evaluation by cross-validation
1. Extraction of features • Compute statistical parameters from EEG (from 4 – 32 Hz in 1 Hz increments): • Spectral coherence between all electrode pairs • Mutual information between all electrode pairs • Absolute and relative power spectral density (PSD) levels • Left-to-right hemisphere power ratios • Anterior/posterior power ratios • Results in 4336 features!
2. Feature Selection • the 4336 candidate features are highly correlated • Most have no statistical dependence with the target variable (response) • We select only those with most statistical relevance using a modified form of the method due to Peng2 2. H. Peng et al IEEE Trans PAMI Aug 2005
2. Feature Selection (Cont’d) • Regularized iterative feature selection based on Kullback-Leibler (KL) distance: • j -th iteration: • First term describes relevance (relationship with target variable) • Second describesredundancy with previous features
3. Classification Procedure • Input: selected feature vector for a specific subject • Output: responder (R) or non-responder (NR) categories for each subject • Classifier structure-- many available: • Support vector machine • Kernelized partial least squares regression (KPLS) procedure • Etc.
4. Performance Evaluation • Nested (11-fold) cross-validation procedure • performance is biased upwards unless training is independent of the test set3 • therefore we perform • -Parameter optimization • -feature selection • -testing • independently in each fold • [3] e.g., Hastie, Tibshirani and Friedman “The elements of Statistical learning”
Results Contingency table for SSRI medication:
2-D representation of feature space obtained using kernel PCA. • multiple points (epochs) per subject • Clustering behaviour verifies that classes can be well separated with a straight line
2-D representation of scatter plot after averaging over available EEG epochs
Overfitting? • it is difficult to prove that the model has not over-fit the data • Rules of thumb • Complexity of model (number of parameters) should be small in comparison to number of training points • Test set must be independent of the training set
A list of most-discriminating features showing the mean and standard deviation of each feature in non-responder (N) and responder (R) groups
Most discriminating features • 9-16Hz bandwidth • Mostly left hemisphere • Dominant electrodes are T3, T5 and C3
Prediction of Response to TranscranialMagnetic Stimulation (rTMS) Using eyes-open pre-treatment EEG, with Nr=5 features 27 MDD subjects Left true rTMS therapy • F/B PSD ratio at 21Hz to 24Hz, C3/O1 • Coherence at 6Hz, between T3 & T5 • Coherence at 9Hz, between C3 & O2 • Coherence at 5Hz and 9 Hz, between P4 & O2 • FL/BR PSD ratio at 30Hz and 34Hz, F1F7F3/T4C4T6 • F/B PSD ratio at 6Hz, F7F3/P3O1
Plans for Commercialization • The method is protected by patent applications • We are currently in the process of gathering more training data to expand the number of medications, and increase quantity of training data • A commercial partner is currently funding this effort • Plans for starting our own company are currently underway • Major market are the health care insurers in Canada, US and worldwide
SOME Arithmetic (USA) For a US corporation with 1000 employees: -10.1 % employees (101) are on antidepressant meds Assumptions using “state of the art” treatment: -66% do not remit with 1st medication -In non-remitters costs rise from $3600 to $16,000 If our method decreases non remission rate to 30% -Savings = 101 X (.66-.3) X ($16,000-$3,600) = $450,864 Projected cost of testing = 101 X $400 =$40,400 SUMMARY: Application of our method could result in savings of $4,064/depressed employee i.e. 11.1 X ROI SUMMARY: Application of our method could result in savings of $4,064/depressed employee i.e. 11.1 X ROI
Discussion and Conclusions • Our results show it is possible to predict response • A surprising result is that a set of discriminating predictive EEG features for prediction do exist • The proposed methodology can result in significantly reduced times to remission • Neurological significance? -- selected features are mostly left temporal and alpha/high-beta band • previous work has identified a subset of the features identified in this study