Download

1 / 29
290 likes | 411 Views
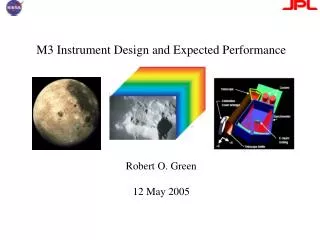
M3 Instrument Design and Expected Performance Robert O. Green 12 May 2005. M3 Science Measurement Requirements. Spectral Range: 400 to 3000 nm at 10 nm sampling Spectral signatures of interest High spectral and spatial uniformity Enables scientific imaging spectroscopy

E N D
M3 Instrument Design and Expected PerformanceRobert O. Green12 May 2005
M3 Science Measurement Requirements • Spectral Range: 400 to 3000 nm at 10 nm sampling • Spectral signatures of interest • High spectral and spatial uniformity • Enables scientific imaging spectroscopy • High Precision (Signal-to-noise ratio) • Low concentration components, low illumination areas of the Moon • Spatial swath 40 km with sampling ~70m • Global coverage from planned orbit and data downlink limits • Excellent calibration (spectral, radiometric, spatial) • Enables scientific imaging spectroscopy • High Instrument and Team heritage • Low risk and science success
M3 Instrument Approach • A simple, high uniformity and high throughput “Zakos” Offner imaging spectrometer design • JPL convex three zone blazed e-beam lithographic grating • 640 by 480 element substrate removed HgCdTe detector array and 6604A readout (sensitive from 400 to 3000 nm) • K508 Ricor cryocooler with backup (Clementine, CRISM, etc.) • Deployable calibration panel for solar view radiometric calibration
M3 Optical Configuration 25 degree FOV unobscured F/3.5 TMA Telescope Slit Single spherical mirror JPL e-beam curved grating OS Filter MCT Detector 400 to 3000 nm 20 mm 1) Telescope mirrors aligned to machine tolerance w/ shims 2) Spectrometer components held to machine tolerance w/ shims plus fine rotation only on grating and detector.
M3 Optical Configuration 24 degree FOV unobscured F/3.5 TMA Telescope Single spherical mirror JPL e-beam curved grating Slit OS Filter 640 cross-track MCT Detector 400 to 3000 nm 1) Telescope mirrors aligned to machine tolerance w/ shims 2) Spectrometer components held to machine tolerance w/ shims plus fine rotation only on grating and detector.
The M3 “Zakos” Design Provides a Uniform Imaging Spectrometer Cross Track Sample Depiction -Grids are the detectors -Spots are the IFOV centers -Colors are the wavelengths Spectral Cross-Track <5% Spectral-IFOV-Shift <5% The keys to M3 are: - Design - Manufacture - Alignment - Stability Cross Track Sample Wavelength
Pushbroom Imaging Spectrometer are Not Inherently UniformExample: Cross-Track Spectral Non-Uniformity Cross Track Sample Depiction -Grids are the detectors -Spots are the IFOV centers -Colors are the wavelengths Hyperion 40% non-uniform Wavelength Cross Track Sample Failure by Twist Wavelength Failure by Frown
Pushbroom Imaging Spectrometer are Not Inherently UniformExample: Spectral-IFOV-Shift Spectral-IFOV-Shift creates spectra where different wavelengths arrive from different locations on the ground. Example 80% SIS Depiction Below -Grids are the detectors -Spots are the IFOV centers -Colors are the wavelengths Wavelength Failure by Spectral-IFOV-shift
The M3 “Zakos” Design Provides a Uniform Imaging Spectrometer Cross Track Sample Cross Track Sample M3 is designed with: Spectral Cross-Track <5% Spectral-IFOV-Shift <5% Wavelength
M3 JPL Three Zone Convex e-Beam Grating The ability to control the area and blaze of multiple zones allows optimization of throughput and signal-to-noise ratio. These gratings also have very low scattered light.
M3 Technology ReadinessJPL Detector Focal Plane and Drive Electronics* • RSC 6604A FPA @JPL • - Dimension 640 by 480 • - Detector pitch 27 microns • Full well ~650,000 e- JPL 6604A Drive electronics Test 6604A Image *These are currently not flight qualified, but exist and function
Example JPL Offner Spectrometer Assembly Grating location Spectrometer Mirror 1 and 2 Entrance Slit SWIR Detector Array
M3 Instrument CharacteristicsSpectral • Range: 400 to 3000 nm • Sampling: 10 nm across spectral range • Response: <=1.2 of sampling FWHM • Accuracy: Calibrated to 5% of sampling • Precision: Stable within 1% of sampling Note: There are three filter zone boundaries where performance will be degraded. (~750, 1400, 2500 nm)
M3 Instrument CharacteristicsRadiometric • Range: 0 to twice equatorial reference radiance • Sampling: 14 bits measured, 12 reported • Response: Linear to 99.5% (after calibration) • Stability: 5% between calibrator views • Accuracy: 10% absolute radiometric calibration • Precision: SNR > 400 equatorial reference, > 100 polar reference
M3 Proposal Instrument SNR Problem: high signal at 1500 nm drives detector read rate to at least 4 reads per ground sample. This drives power, data handling, mass and risk saturation.
M3 Current Instrument SNR Solution: Adjust the efficiency spectrum of the grating. This is possible with JPL ebeam lithographic grating technology. Less risk of saturation and better SNR margin at 3000 nm.
M3 Instrument CharacteristicsSpatial • Range: 40 km swath (24 degree field-of-view) • Sampling: 70 meters average cross and along track (600 cross-track samples) • Response: FWHM of IFOV @ <1.2 of sampling • Accuracy: 0.1of IFOV
M3 Instrument CharacteristicsSpatial • Surface Projected slit images has 0.313 degrees of curve over +- 12 FOV • Will be calibrated and included in georectification • Less than distortions imposed by topography • Less than distortions from framing camera approach • Basically, this degree of freedom is used to help gain the spectral cross-track and spectra-IFOV-Shift uniformity
M3 Instrument CharacteristicsUniformity • Spectral-Uniformity: < 10% variation of spectral position and FWHM across the field of view • Spectral-IFOV-Shift: < 10% IFOVs variation over the spectral range • Vignetting: Radiometric response within 10% across the field-of-view Wavelength Cross Track Sample
Calibration S/C REFERENCE FRAME Calibration Panel Normal +Y (Velocity) +Z (Anti Sun) Sun Vector (At Calibration) +X (Moon Nadir)
M3 Data Modes and Limitations • Global Mode • Lossless compression sufficient to map the lunar globe in one optical imaging period within data rate constraints • Nominally 2 by 2 spatial and 3 spectral averaging • 335 Orbits • Target Mode (three optical imaging periods) • Full spectral and spatial resolution • Nominally 600 by 600 scene • As many scenes as permitted within available data rate • ~3800 per optical imaging period • The available data rate may be less than assumed in the proposal • A NASA Deep Space Network option is being explored. DSN would help greatly.
M3 Additional Characteristics • Baseline dark signal data will be acquired from the un-illuminated portion of the moon on each imaging orbit. • Cross-track elements 1-10 and 631-640 are masked and used to monitor dark signal levels during the imaging orbit. • Cross-track elements 11-20 and 621-630 are not illuminated by the spectrometer slit and are used to monitor scattered light.
M3 Instrument Science Commands • These are the envisioned basic instrument commands for science data measurement. • Global Mode • Maybe upload averaging table • Target mode • Start collect • Stop collect • Deploy calibration panel • Retract calibration panel • Integrations per ground sample (1,2 or possibly 3) • There will be many other derived commands to allow the instrument to function
The team, approach and capability to achieve these M3 Science Measurement Requirements is in Place • Spectral Range: 400 to 3000 nm at 10 nm sampling • Spectral signatures of interest • High spectral and spatial uniformity • Enables scientific imaging spectroscopy • High Precision (Signal-to-noise ratio) • Low concentration components, low illumination areas of the Moon • Spatial swath 40 km with sampling ~70m • Global coverage from planned orbit and data downlink limits • Excellent calibration (spectral, radiometric, spatial) • Enables scientific imaging spectroscopy • High Instrument and Team heritage • Low risk and science success
M3 Optical Configuration 25 degree FOV unobscured F/3.5 TMA Telescope Single spherical mirror JPL e-beam curved grating Slit OS Filter 640 cross-track MCT Detector 400 to 3000 nm 1) Telescope mirrors aligned to machine tolerance w/ shims 2) Spectrometer components held to machine tolerance w/ shims plus fine rotation only on grating and detector.