Download
1 / 1
10 likes | 87 Views
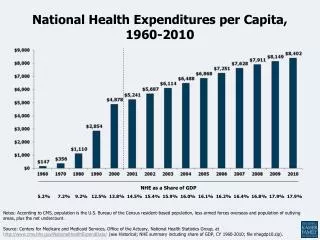
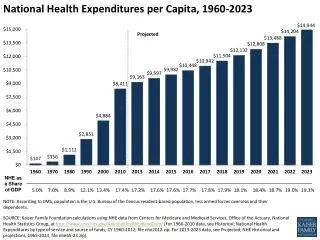
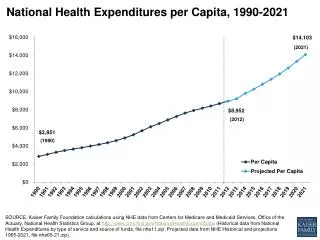
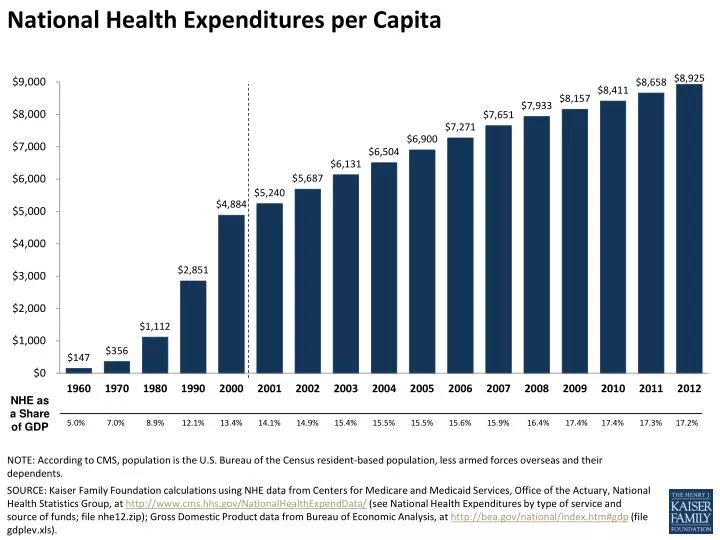
National Health Expenditures per Capita. NHE as a Share of GDP. 5.0% 7.0% 8.9% 12.1% 13.4% 14.1% 14.9% 15.4% 15.5% 15.5% 15.6% 15.9% 16.4% 17.4% 17.4% 17.3% 17.2 %.

E N D
National Health Expenditures per Capita NHE as a Share of GDP 5.0% 7.0% 8.9% 12.1% 13.4% 14.1% 14.9% 15.4% 15.5% 15.5% 15.6% 15.9% 16.4% 17.4% 17.4% 17.3% 17.2% NOTE: According to CMS, population is the U.S. Bureau of the Census resident-based population, less armed forces overseas and their dependents. SOURCE: Kaiser Family Foundation calculations using NHE data from Centers for Medicare and Medicaid Services, Office of the Actuary, National Health Statistics Group, at http://www.cms.hhs.gov/NationalHealthExpendData/ (see National Health Expenditures by type of service and source of funds; file nhe12.zip); Gross Domestic Product data from Bureau of Economic Analysis, at http://bea.gov/national/index.htm#gdp (file gdplev.xls).