Download
1 / 29
290 likes | 409 Views
Systematics: Carbon in Aquatic Plants. Why do we care?. Food Web Dynamics Ancient [CO 2 ] aq and p CO 2 concentrations Cell Mechanisms (diffusion/assimilation) in different marine environments. Why are there variations in 13 C of aquatic plants?. Water Temperature.

E N D
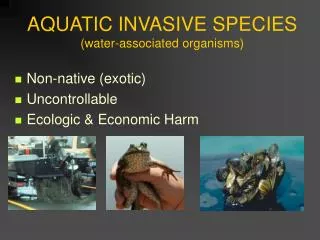
Systematics: Carbon in Aquatic Plants
Why do we care? • Food Web Dynamics • Ancient [CO2]aq and pCO2 concentrations • Cell Mechanisms (diffusion/assimilation) in different marine environments
Why are there variations in 13C of aquatic plants? Water Temperature pCO2 and [CO2]aq Growth Rate Cell Size and Geometry Type of Organism Active vs. Diffusive Inorganic C uptake CCM (CO2 concentrating mechanisms)
13C variances with Temperature and Latitude Lower 13C values found in cold, southerly latitude Antarctic waters Less variability shown in Arctic waters
Stable carbon isotopes in marine organic matter vary significantly over geologic time. Cretaceous sediments are thought to have existed in a time with elevated CO2 levels. First study to show relationship between phytoplankton 13C and CO2 concentrations.
Temperature vs. Latitude and Temperature vs. pCO2 pCO2 has highest variability at coldest temperatures; however high pCO2 found at all temps Colder at higher latitudes
13C vs. [CO2]aq [CO2]aq = x pCO2 [CO2]aq is dissolved CO2 concentration; is solubility constant (a function of temp) Greater fractionation at higher [CO2]aq and colder temps
Cretaceous [CO2 ]aq [CO2]aq = x pCO2 Today [CO2]aq~ 20 M @ T = -2 to +2°C To calculate Cretaceous atmospheric CO2 concentrations: 1) Low productivity Cretaceous ocean 2) 32°C Cretaceous ocean 3) Modern Antarctic ≈ Cretaceous Atlantic 13C (low) 4) Similar 13C means similar [CO2]aq Plug and chug! Low latitude Cretaceous ocean >800 pmv 2 - 13 x higher than prior estimates
Why are there variations in 13C of aquatic plants? Water Temperature pCO2 and [CO2]aq Growth Rate Type of Organism Cell Size and Geometry Active vs Diffusive Inorganic C uptake CCM (CO2 concentrating mechanisms)
Cultured diatom to test growth rate CO2 variability. Measure p (aka isotopic discrimination factor) p = 1000(e-p)/(1000+p) p = 1000(-1) Phaeodactylum tricornutum
CO2 (g) CO2 (aq) Dissolution (Henry’s law, T dependent) Rubisco + -carboxylase carboxylations εp = 25-28‰ when growth rate 0 Equilibrium εHCO3/CO2 = +9‰ @ 25°C H+ + HCO3- CO2 (aq) + H2O H2CO3
Growth Rate vs. Fractionation Low CO2 = Faster growth rates = Lower p Remember: Rubisco + -carboxylase carboxylations εp = 25-28‰ when growth rate 0
Predicted growth rate based off [CO2]aq to be 0.58 d-1. That is almost identical to mean values in the Eq. Pacific (0.585 d-1). Mid-range p values suggest that plankton are not actively transporting carbon (unless <10mol CO2)
“Cell size effects may change slope of p vs /[CO2]aq sufficiently to invalidate growth rates determined from p and [CO2]aq, but these cases are likely to be the exception rather than the rule.” Cell Volume of diatom in this study = 100m3 Average plankton has diameter = 1 m
Why are there variations in 13C of aquatic plants? Water Temperature pCO2 and [CO2]aq Growth Rate Type of Organism Cell Size and Geometry Active vs Diffusive Inorganic C uptake CCM (CO2 concentrating mechanisms)
Cell Size effects on p under variable growth rates Max (25‰) fractionation associated with Rubisco and -carboxylases at low grow rate or high pCO2 2.4 SA/V 4.4 SA/V 1.1 SA/V 0.2 SA/V Cell size (and shape) influence p, with great impacts on large and/or round cells. What’s up with Synechococcus?
Cell Size effects on p under variable growth rates For eukaryotes, can scale V/SA and all fall on a single relationship. 2.4 SA/V 1.1 SA/V 0.2 SA/V Conclude cells assimilate carbon by diffusive and ACTIVE uptake or conversion of bicarbonate to CO2
To understand C isotope fractionation in marine phytoplankton must know: f Growth rate [CO2]aq Cellular carbon-to-surface area ratio (or volume-to-surface ratio) εp is greater for small, slow-growing, high surface/volume Such algae have low δ13C values εp is smaller for large, fast growing, low surface/volume Such algae have high δ13C values Onshore-Offshore isotope Gradients: For those who love the food webs, this explains the difference in δ13C values from coastal to offshore waters. Plankton in upwelling zones grow faster and tend to be bigger. Plankton in offshore regions are smaller and grow slower. The differences can be 2 to 3‰, with lower values offshore. This happens despite the fact that upwelling is bringing up 13C-depleted water.
Why are there variations in 13C of aquatic plants? Water Temperature pCO2 and [CO2]aq Growth Rate Type of Organism Cell Size and Geometry Active vs Diffusive Inorganic C uptake CCM (CO2 concentrating mechanisms)
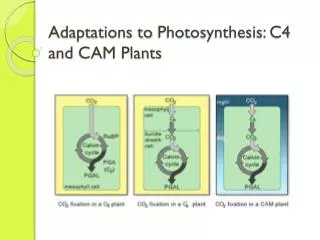
C3 vs. C4 photosynthesis: C4 in the ocean Diatoms growing in low CO2 conditions have enriched 13C values - possibly undergo C4 assimilation.
Increase in PEP with low CO2 or Low Zn (≈low carbonic anhydrase)
C4 compound malate: 70% after 15 sec and 25% after 2 hr in low Zn conditions sugars Malate is being decarboxylated and released CO2 is fixed by Rubisco to form sugars and phosphoglyceric acid (PGA) malate PGA
Diffusion or Active Uptake in C4 plankton? Active HCO3 uptake (PEP and CA activity) rather than passively diffusing dissolved CO2(aq) results in higher 13C values (-10‰) These values found in diatoms during the Mesozoic…before C4 found in terrestrial land plants
Active HCO3 uptake in this coastal, upwelling region Monterey Bay lower p than global, Peru diatoms even lower. Attributed to CO2 concentrating mechanisms. This mechanism is not always restricted to diatoms.
Moving on from phytoplankton to coastal macroalgae and seagrasses MAJOR review paper (super wordy yet not very synthetic)
13C differences on large data set 565 species assessed! Low 13C values (<-30‰) mainly subtidal red macroalgae High 13C values (>-10‰) mainly green macroalgae and seagrasses
Low 13C values (<-30‰) mainly subtidal red macroalgae (HIGHER p) • rely on diffusive CO2 supply to Rubisco • conversion of photosynthate to lipids; more negative 13C inputs (terr); low photon flux densities • lack of pyrenoids result in no CO2 concentrating mechanisms • C4-like metabolism High 13C values (>-10‰) mainly green macroalgae and seagrasses (LOWER p) • uptake of HCO3 combined with a CO2 concentrating mechanism • very little leakage
What does all this mean? • Aquatic plants have complex fractionation and carbon uptake mechanisms. • Many factors have been discovered to influence 13C and p values and more are to come in the future. • Be careful when making trophic level assumptions and predicting ancient CO2 levels.