Download
1 / 11
110 likes | 205 Views
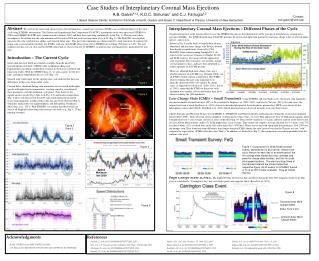
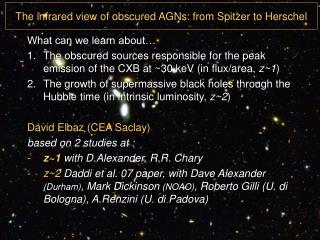
Hui Tian High Altitude Observatory, National Center for Atmospheric Research. What can we learn about coronal mass ejections through spectroscopic observations . ASP research review. 2011/10/5 . Observation of the corona. Habbal et al. 2010, ApJ. Fe X 174 Å, imager.

E N D
HuiTian High Altitude Observatory, National Center for Atmospheric Research What can we learn about coronal mass ejections through spectroscopic observations ASP research review 2011/10/5
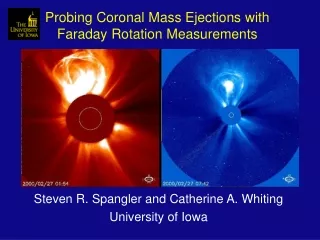
Observation of the corona Habbal et al. 2010,ApJ Fe X 174 Å, imager Fe X 6374 Å, solar eclipse • White light • Ground & space • Eclipse • Coronagraph • UV & X-ray • Space • Imager • Coronagraph • Spectrograph/spectrometer SOHO LASCO-2 Lower corona, coronagraph Extended corona, coronagraph
Coronal mass ejections (CMEs) • Occurring frequency • Solar maximum: 3-5 per day • Solar minimum: 1 every 3-5 days • Mass: 2 × 10¹⁴-16g • Speed: 200-2000 km/s • Sometimes dimmings in EUV & X-ray Credit: STEREO Science Center
Space weather • Earth-directed CMEs are potentially dangerous to our high-tech systems • Satellite anomalies, orbit changes, health of astronauts • Disruption of GPS & other spacecraft signals, radio signals • Damage of electric power grids & pipelines • Imaging observations at the Earth orbit can not observe the evolution of Earth-directed CMEs Credit: SwRI Credit: SOHO Daily MPEG Credit: STEREO Science Center
EUV spectroscopy Curdt et al. 2001, A&A
Line profiles in the ejecta • Two well-separated components • A nearly stationary background • A high-speed components (~200 km/s) representing the emission of the ejecta • Calculate the real speed: v=Sqrt(vpos2+vlos2)
Spectroscopic observations of coronal dimmings Attrill et al. 2010, Sol. Phys. McIntosh,ApJ, 2009 • ~20 km/s Blue shift: outflows refilling the corona • Enhanced line width: growth of wave amplitude
Two emission components in dimming regions • Two emission components • A nearly stationary background • A weak high-speed (~100 km/s) components representing outflows • Blue shift of ~ 20 km/s and enhanced line width are caused by the superposition of the two components • Only a small portion of the materials in the dimming region are flowing outward • The outflow speed is around 100 km/s
Conclusion • Spectroscopic observations can provide valuable information on the kinematics of CMEs • 3-D CME evolutions can be obtained by simultaneous imaging and spectroscopic observations • The outflow speed in the dimming region is of the order of 100 km/s, not ~20 km/s