Download

1 / 25
250 likes | 376 Views
The Crisis Residential Center’s. Direction Program Effectiveness Study. To Those Who Made This All Possible. Supportive Figures Eastern Washington University Dr. Ed Byrnes Katie Clemons-Handy Dr. Sarah Keller Dr. Kim Stansbury Crisis Residential Center Brandon Livingston Teresa Wright.

E N D
The Crisis Residential Center’s Direction Program Effectiveness Study
To Those Who Made This All Possible Supportive Figures Eastern Washington University Dr. Ed Byrnes Katie Clemons-Handy Dr. Sarah Keller Dr. Kim Stansbury Crisis Residential Center Brandon Livingston Teresa Wright Research Fellows • Jennifer Boisen • Jacob Campbell • Shireen Wheeler
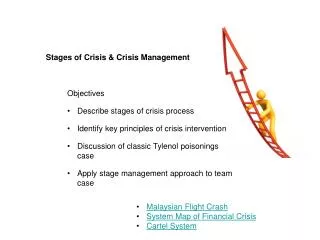
Presentation Roadmap • What it’s all about • What we did • What it means • What to take away
What it’s all about Literature Review
Working with At-risk Youth • Reasons for Runaway and Homeless Youth • Support and nurturing • Single parent homes • Abuse and neglect • Substance use / abuse • Common Problems • Academic • Positive social networks • Mental & physical health issues
Programs & At-risk Youth • Milieu environment • Individual • Group • Family • Referrals
About the CRC • YFA Connections • Safety-net for Spokane • General population • Three programs
What we did Methodology
The Plan: Archive data from files. Demographics, programmatic info, hx & GAIN-SS Parent surveys Quantitative & Qualitative. Client surveys Post GAIN-SS In-depth interviews Reality: Archive data from files. Demographics, programmatic info. & hx. Parent surveys Qualitative only. Methodology
Data Analysis • Data from files • Descriptive Analyses • Demographic variables • Programmatic variables • Client history & issues • Cross tabulation • Chi Square • Qualitative info • Look for commonalities and use to support/discuss findings/recommendations.
What it means }{ Findings }{}{ Limitations}{}{}{ Implications
AGE The majority of the youth, 31, were 14 years old. This is followed by 16 year olds, 17 and 15 year olds 28, 25, and 25 respectively. Thirteen year olds constituted the least at 19.
Length of Stay The average stay or mean for the youth was 190.30. In addition, there was the same number youth who spent more than 187 hours and spent less than 187 hours. The most frequent length of stay was 1.5 hours.
Gender The majority of the youth were female at 67 and the next was highest was male at 58. There was 1 individual who said that they felt that they were a woman instead of a man.
Limitations • Time • Response rate • Outdated information • Biases-social bias • Not being able to support our hypotheses • Only sent surveys to legal guardian addresses • Instrumentation not tested and no control group
Implications for Social Work • Further research • Begins to determine the effectiveness of the program
What to take away }{ Correlative data }{}{ Recommendations }{}{}{ Future research }{}{}{}{ Conclusions
Correlative data Homelessness & School Status • n = 21 yes homeless • Problems: Irregular, dropped out, suspended, and expelled • Total: 33.4% • Pearson Chi-Square: 0.351
Correlative data Homelessness & Mental Health Issues • n = 21 yes homeless • n = 35 yes mental health issues • Problems: Issues related to the mental health status of youth or family members • Total: 23.8% • Pearson Chi-Square: 0.000 (a. 5 cells (55.6%) have expected count less than 5. The minimum expected count is .13.)
Correlative data Family Sessions & Household Dynamics • n = 120 yes household dynamics • Problems: issues related to interactions and interrelationships within the household (for example, frequent arguments between household members • By the numbers: 0 hours → 26.7% || 0.01-2 hours → 26.7% || 2.01-4 hours → 24.2% || 4.01- 6 hours → 21.7% || Over 6.01 hours → 0.8% || • Pearson Chi-Square: 0.758
Correlative data Family Sessions & Drug Use and Abuse • n = 31 yes Drug Use and Abuse • Pearson Chi-Square: 0.907
Recommendations • File / data collection • Aftercare • Follow-up • More training regarding therapy • More individual time • Substance use / abuse
Future Research • In-depth interviews • More surveys • Secondary paper
Conclusion • New questions • Poor and dynamic data • Expected data continuation
Questions ?’s