Download
1 / 23
230 likes | 319 Views
Study on reoxygenation-related cell death in tumour cords and split-dose treatment responses. investigate radiosensitivity and reoxygenation impact on treatment.

E N D
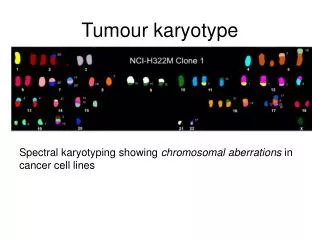
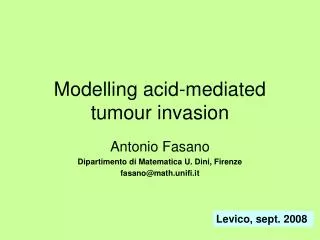
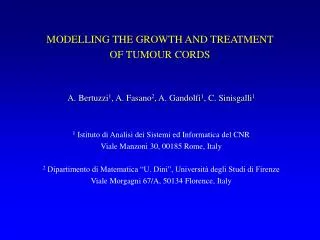
MODELLING THE GROWTH AND TREATMENT OF TUMOUR CORDS A. Bertuzzi1, A. Fasano2, A. Gandolfi1, C. Sinisgalli1 1 Istituto di Analisi dei Sistemi ed Informatica del CNR Viale Manzoni 30, 00185 Rome, Italy 2 Dipartimento di Matematica “U. Dini”, Università degli Studi di Firenze Viale Morgagni 67/A, 50134 Florence, Italy
RESENSITISATION AFTER TREATMENT • After a single dose of radiation or drug administered as a bolus, important changes will occur in the oxygenation and nutritional status of surviving cells, as well as in the distribution of cells between the proliferating and quiescent compartment and among the cell cycle phases. • These changes are transient, because tumour regrowth tends to restore the pretreatment status. • As a consequence, changes in the sensitivity of the cell population to a successive administration of the agent are expected to occur. AIM • We have studied the reoxygenation related to cell death in tumour cords and its effect on the response to split-dose treatment. • We did not consider the redistribution among cell cycle phases (resensitisation and resonance effects).
where: N number of clonogenically viable cells, U mean number of DNA double strand breaks (DSB) per cell, dose rate, wDSB repair rate, k binary misrepair rate. (No proliferation of viable cells) . D RADIOTHERAPY Irradiation induces a lethal damage in a fraction of cells (that become clonogenically dead). Clonogenically dead cells will die at a later time. We assume that before irradiation all cells are clonogenically viable. After irradiation: clonogenically viable cells live cells clonogenically dead cells • Kinetics of damage induction and repair (Curtis, 1986; Hlatky et al., 1994). • Two pathways of lethal damage production: direct action and binary misrepair.
The kinetic model explains the linear-quadratic (LQ) model for the surviving fraction (Thames, 1985): Surviving fraction • Single impulsive dose (D) where • Split-dose (D/2+ D/2) where T is the inter-fraction interval. Note: the survival after a split-dose is larger than the survival after the undivided dose. The radiosensitivity parameters a and b depend on the oxygenation level of the cells. The LQ model does not include the effect of reoxygenation and regrowth.
IDEAL VASCULARIZATIONKrogh’s cylinders and tumour cords Assumption: vessels move solidly with the tumour tissue. r radial distance r0 vessel radius rNcord radius B cord (+necrosis) outer boundary
MAIN ASSUMPTIONS • Cylindrical symmetry. • Cell population variables and concentration of chemicals independent of z. • Cell velocityuradially directed and independent of z. • No exchange of matter at the boundary r=B(t). • Oxygen is the only “nutrient” considered. (r,t)denotes its local concentration. • Cells die if falls to a threshold N. Additional cell death induced by treatment can occur in the viable region. Dead cells are degraded to a fluid waste with rate mN. • Viable cells are subdivided into proliferating (P) and quiescent (Q). nPandnQ denote the volume fractions occupied locally by P and Q cells. P cells proliferate with rate . Transition PQ is governed by the rate (), and transition Q P by (). • The volume fraction of extracellular fluid, nE , is constant. • All components have the same mass density. BDFG, Bull. Math. Biol., 2003; BFG, SIAM J. Math. Anal., 2004
nQ g l n† nP m c nN mN MODEL EQUATIONS (impulsive irradiation) • Cell populations nP, nQ, n†,nN: local volume fractions of (clonogenically) viable P cells, viable Q cells, lethally damaged cells and dead cells; XP, XQmean number of DSBs per P,Q cell; s(r,t)oxygen concentration. g l sN s* Since we assume nP+nQ+n†+nN=n* constant, the velocity field u(r,t) is given by Direct action of radiation will be represented by the initial conditions.
Treatment A sequence of impulsive irradiations given with dose Di at time ti, i=1,2…n, t1=0. where (Wouters & Brown, 1997) At t = 0-, nP(r, 0-) = nP0(r), nQ(r, 0-) = nQ0(r) and all the other state variables are zero.
Oxygen concentration and viable cord boundary • In the absence of necrosis: Outer boundary: • In the presence of surrounding necrosis: material interface non-material interface
SINGLE-DOSE RESPONSE No necrosis (Crokart et al., 2005)
Time course of viable cells 0 T SPLIT-DOSE RESPONSE Comparing 1 dose Dvs.2 doses D/2 delivered with interval T.
0 t= 0 min ClV2 T Survival Ratio = min ClV1 Closed symbols: SR predicted by the model (no necrosis). Apparent radiosensitivity at t = 0: a = 0.304 and b = 0.054. D = 8Gy. Open symbols: SR predicted with a and b independent of sand equal to a and b. SPLIT-DOSE RESPONSE Comparing Dvs.D/2+D/2by Survival Ratio ClV1volume of clonogenically viable cells after 1 dose D ClV2the same quantity in the case of 2 doses D/2
Split-dose response Change in inter-vessel distance Change of repair rate B=80mm w=2 90mm 0.5 0.25 100mm necrosis Till & McCulloch, 1963
ADVANTAGE OF FRACTIONATION • Dose splitting increases the survival of irradiated cells by sparing the normal tissue, but reducing the tumour cell killing. • Since normal tissues are characterized by different andb values, conditions can be found in which the sparing of normal tissue exceeds the reduction of tumour cells killing. • Therefore, higher total doses can be delivered, obtaining an ultimate gain in tumour mass reduction. • The effect of reoxygenation on radiosensitivity is likely to be greater in the tumour than in the normal tissue, owing to the lower mean oxygenation level in tumours. This fact further enhances the therapeutic advantage of dose fractionation. • A more accurate assessment of reoxygenation dynamics might help in optimizing this advantage.
THERAPEUTIC INDEXSplit-dose treatment Extended LQ model Sn* I = St * Tumour cord model Sn*minimal survival acceptable for normal tissue. For each T,let D* be the dose producing the survival Sn* St*survival of tumour cells after the dose D* Normal tissue: a=0.2Gy-1, b=0.067Gy-2 Tumour: a=0.5Gy-1, b=0.05Gy-2 (left); aM=0.6Gy-1, bM=0.075Gy-2 (right)
CONCLUSIONS I • The present analysis confirms that the reoxygenation occurring after the first radiation dose can substantially affect the efficacy of a successive dose. • The extent of cell resensitisation appears to be related in a complex way to the parameters characterizing the vasculature as well as to the intrinsic radiosensitivity of cells. • A more complex model would be needed to describe the phase-specific effects of radiation and the dynamics of cell redistribution among the cell-cycle phases. Moreover, the transient changes in perfusion might be included.
Other applications of the cord model • A similar approach has been followed to analyse the split-dose response to a cycle-specific cytotoxic drug, highlighting the role of the possible cell recruitment from quiescence to proliferation (BFGS, J. Theor. Biol., 2007). • To better investigate the transport of drugs, the extracellular fluid motion and the interstitial pressure have been included in the cord model (BFGS, Math. Biosci. Engng., 2005; BFG, Math. Mod. Meth. Appl. Sci., 2005). • The diffusive and convective transport of monoclonal antibodies and the binding to cell membrane antigens have been modelled (BFGS, Springer, 2007).
b1 b2 cell ANTIBODY TRANSPORT IN A STEADY-STATE CORD Monoclonal antibodies specific to tumour antigens and conjugated to radio-nuclides have been proposed in cancer therapy. We consider the transport and binding of inert bivalent antibodies (Ab) in a cord at steady state (surrounded by necrosis). Denoting by the symbol (^) the concentrations on the cell surface, the transport equations will be given in terms of the variables: whereb1(r,t) and b2(r,t) are the concentrations (referred to the extracellular volume) of monovalently and bivalently bound Abs; S is the total antigen (Ag) concentration; a* is the area of cellular surface per unit volume. The concentration of extracellular free Ab will be denoted by c(r,t). Free and bound Ag in extracellular fluid are disregarded. BFGS, Springer, 2007
Mass balance of drug, r ( r0 , rN) with Boundary conditions at r = r0: where Pe is given by and D is the interstitial diffusivity, P the vessel permeability, f the retardation factor, sf the filtration reflection coefficient and cb(t) the Ab concentration in blood.
In the necrotic region, we define: where aN is the area of cellular surface per unit volume in N, taken as aN /a*= nN /n*. We have: Boundary conditions at r=rN Boundary condition at r=B
Distribution of free (blue) and bound (red) Ab following i.v. bolus- Low convection case - high low Ab affinity
Distribution of free (blue) and bound (red) Ab following i.v. bolus.- High convection case - high low Ab affinity
CONCLUSIONS II • The proposed model, that includes the interstitial fluid motion and the dynamics of necrotic region, provides an improved description of the transport within the cord of agents of high molecular weight, such as monoclonal antibodies. The model extends the work by Fujimori et al. (1989). • The simulation results evidenced that the convective transport may significantly contribute to raise the bound Ab concentration at the cord periphery. • In the case of low convection, the high binding to cell surface antigens results in a “barrier” to Ab penetration, and generates a more heterogeneous Ab distribution.