Download
1 / 12
120 likes | 400 Views
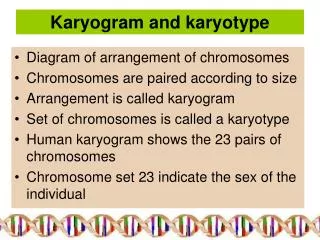
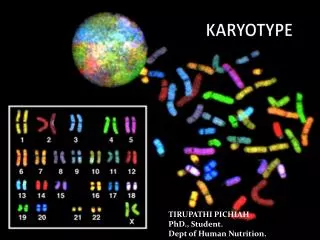
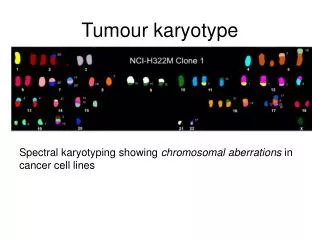
Tumour karyotype. Spectral karyotyping showing chromosomal aberrations in cancer cell lines. Chromosomal aberrations. Segments of DNA that get duplicated Gains Segments of DNA that get deleted Losses

E N D
Tumour karyotype Spectral karyotyping showing chromosomal aberrations in cancer cell lines
Chromosomal aberrations • Segments of DNA that get duplicated • Gains • Segments of DNA that get deleted • Losses • Chromosomal aberrations are being investigated as diagnostic indicators of cancer and other diseases • Better diagnosis of disease • Potentially reveals biomolecular mechanisms of disease • This research is done using: • array comparative genomic hybridization (aCGH) • Measures DNA copy number changes
Array CGH • Array CGH is a genetic technique used to identify chromosomal aberrations in cancer • High resolution • Full coverage
Array CGH data • Measures log2 ratios of normal vs sample for pre-specified segments of the genome called clones • Theoretical log2 ratios: • 1 copy gain (duplication) = log(3/2) = 0.58 • Neutral = log (2/2) = 0 • 1 copy loss (deletion) = log(1/2) = -1 • Measurement based on detection of hybridization level to probes on an array • ~30,000 measurements per sample
Computational challenges • Noisy signals • Spatial dependence between adjacent clones • Outliers • Systematic errors • Copy number polymorphisms
Our approach • Use a “supervised” hidden Markov model (HMM) to model spatial dependency between clones • States are loss, neutral, gain-one, gain-many • Infer the unobserved state sequence from the data using a standard efficient algorithm called for forwards-backwards • This part of the model is standard • Use a Gaussian mixture model to model the outliers separately from the inliers • Inliers have spatial dependence • Outliers do not • Use prior knowledge about locations of CNPs to ‘inform’ the model about possible locations of outliers • Several published lists of CNPs are available • Internally generated list more comprehensive • Pool data across chromosomes to gain “statistical strength”
Test data • Mantle cell lymphoma cell lines with “ground truth” • 123 losses and 72 gains covering approximately 1% of the human genome • Compare results to state-of-the-art algorithms
Results LSP-HMM-C had 97% recall and 83% precision
Example results LSP-HMM
Example results MERGELEVELS Base-HMM
Conclusions • HMM framework superior to MergeLevels • Adding robustness further improves performance over the ‘Base-HMM’ • Adding LSP information improves performance marginally over robust HMM, but importantly does not make results worse • Motivation for using more comprehensive lists to improve results • Some false positives – are they real? • Pooling across chromosomes results in big gains • Data more easily overwhelms incorrect priors • Makes the algorithm less sensitive to parameter settings