Download
1 / 6
60 likes | 143 Views
Explore annual inflation, depreciation, asset composition, real returns, and risk-return trade-offs in Israel's financial market from 1958 to 2001. This study covers public asset types, currency dependencies, and efficient frontier analysis across different asset price indexes. Utilize the insights to make informed investment decisions.

E N D
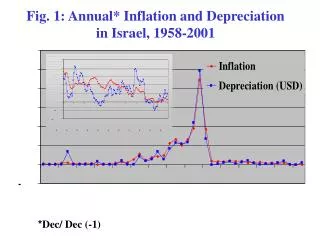
Fig. 1: Annual* Inflation and Depreciation in Israel, 1958-2001 * Dec/ Dec (-1)
Table 1: Composition of Financial Assets of Public, Excl. Common Stock (percent) * In foreign currency & linked to exchange rate.
Table 2: Required Real Returns on Principal Groups of Financial Assets (Avg. 1994-2000)(percent)
Fig. 2: Efficient Frontier for Four Principal Asset Price Indexes Shares Unindexed Market Portfolio FX-Linked CPI-indexed Period: 1996-2000
Fig. 3: Efficient Frontier for Four Principal Asset Price Indexes Shares Unindexed FX-Linked CPI-indexed Brown dots for period: 1/99 – 4/02
U0 O 100% Foreign C B 100% U.S. A Fig. 4: Risk Return Trade-off:Portfolios of U.S. and Foreign Mutual Funds Source: Lewis (1999) Standard Deviation of Wealth