Download
1 / 1
10 likes | 92 Views
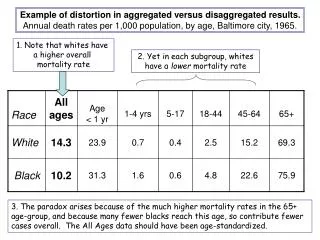
Explore the interplay between aggregated and disaggregated death rates, revealing paradoxes in mortality trends by age and race in Baltimore city in 1965. Analysis highlights higher overall mortality rate in whites but lower rates within subgroups due to higher rates in the 65+ age group and fewer elderly Black individuals. The importance of age-standardized data in interpreting mortality patterns is emphasized.

E N D
Example of distortion in aggregated versus disaggregated results.Annual death rates per 1,000 population, by age, Baltimore city, 1965. 1. Note that whites have a higher overall mortality rate 2. Yet in each subgroup, whiteshave a lower mortality rate 3. The paradox arises because of the much higher mortality rates in the 65+ age-group, and because many fewer blacks reach this age, so contribute fewer cases overall. The All Ages data should have been age-standardized.