Download
1 / 5
50 likes | 155 Views
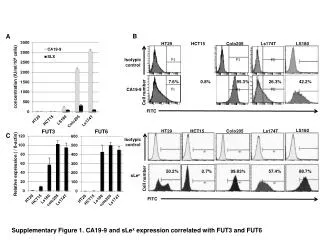
B. A. HT29. HCT15. Colo205. Ls174T. LS180. Isotypic control. concentration (IU/ml/10 6 cells). 7.6%. 0.8%. 95.3%. 26.3%. 42.2%. CA19-9. Cell number. FITC. LS180. FUT3. FUT6. HT29. HCT15. Colo205. Ls174T. C. Isotypic control. Relative expression ( / ß-actin). 50.2%.

E N D
B A HT29 HCT15 Colo205 Ls174T LS180 Isotypic control concentration (IU/ml/106 cells) 7.6% 0.8% 95.3% 26.3% 42.2% CA19-9 Cell number FITC LS180 FUT3 FUT6 HT29 HCT15 Colo205 Ls174T C Isotypic control Relative expression ( / ß-actin) 50.2% 0.7% 99.83% 57.4% 88.7% sLex Cell number FITC Supplementary Figure 1. CA19-9 and sLex expression correlated with FUT3 and FUT6
B A siFUT3 + siFUT6 Random Colo205 LS174T No treat siFUT3 FUT3 1.0 0.94 0.23 0.22 ß-actin siFUT3 + siFUT6 Random No treat siFUT6 FUT6 1.0 1.02 0.28 0.30 ß-actin Supplementary Figure 2. Suppression of FUT3 and/or FUT6 by siRNAs
A random siRNA1 siRNA2 FUT1 1.0 0.26 0.28 FUT2 1.0 0.36 0.32 FUT4 1.0 0.21 0.22 FUT5 1.0 0.44 0.72 FUT7 1.0 0.33 0.43 FUT8 1.0 0.27 0.35 B NT Random siFUT1 siFUT2 siFUT4 siFUT5 siFUT7 siFUT8 pSmad2 1.0 1.36 1.0 1.25 1.0 3.17 1.0 1.38 1.0 1.33 1.0 1.42 1.0 1.52 1.0 1.35 Smad2 – + – + – + – + – + – + – + – + TGF-β Supplementary Figure 3. Suppression of FUT3 and FUT6 inhibits Smad2 phosphorylation upon TGF-ß stimulation
TGF-β (hr) IgG 0 6 12 TßR-I IP / AAL IB TßR-I 1.00 1.05 1.04 TßR-I IP / TßRI IB TßR-I Supplementary Figure 4. Fucosylation of TßR-I was not affected by TGF-ß stimulation
siFUT3 + 6 Random siFUT3 siFUT6 NT TßR-I IP / CA19-9 IB 1.00 1.05 0.35 0.25 0.29 siFUT3 + 6 Random siFUT3 siFUT6 NT TßR-I IP / sLex IB 1.00 0.93 0.34 0.23 0.16 Supplementary Figure 5. TßRs bound-CA19-9 and sLex inhibited by siFUT3 and/or siFUT6


