Download
1 / 53
530 likes | 727 Views
An Analysis of Nitrogen Loads to Hood Canal. Anthony Paulson Chris Konrad Gary Turney U.S. Geological Survey Tacoma, WA Preliminary results, subject to revision Revised based on meeting of May 13, 2004. Objective.

E N D
An Analysis of Nitrogen Loads to Hood Canal Anthony Paulson Chris Konrad Gary Turney U.S. Geological Survey Tacoma, WA Preliminary results, subject to revision Revised based on meeting of May 13, 2004
Objective • Assess sources and determine loads of nitrogen compounds discharged to Hood Canal
General Approach • Make initial estimates of nitrogen loading using available data and information • Design and conduct focus studies to better quantify loading from major sources and/or to sensitive areas of Hood Canal • Improve the initial load estimates using the results of the focus studies
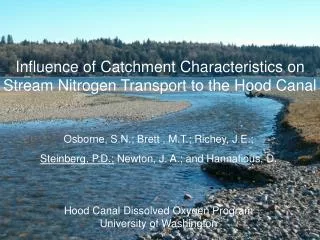
Preliminary, subject to revision Nitrogen Loads From River and Stream Basins to Hood Canal Christopher Konrad U.S. Geological Survey Tacoma, WA
Objectives • Estimate annual and monthly inorganic nitrogen load to the Hood Canal from streamflow and regional ground water for each river and stream basin draining to the canal including shoreline catchments with ephemeral streams. • These loads do not include direct inputs to the canal (e.g., some stormwater runoff, fish carcasses, shoreline septic effluent).
Approach for Calculating Surface-Water and Regional Ground-Water Loads LOAD = FLOW x CONCENTRATION x TIME FLOW • Streamflow (Qsw) was estimated from streamflow records and regional streamflow-drainage area relations. • Ground-water flow (Qgw) estimated from mass balance. CONCENTRATION • Inorganic nitrogen concentrations [N] were compiled from Department of Ecology, U.S. Environmental Protection Agency, and U.S. Geological Survey data.
Hood Canal Watershed Total drainage area of 1,020 sq. miles Four distinct hydroclimatic regions 1. Lowland rivers (Tahuya, Union, Dewatto) and streams on the Kitsap peninsula, south shore, and east shore 2. North Olympic rivers (Big Quilcene, Little Quilcene) and streams 3. South Olympic rivers (Dosewallips, Duckabush, Hamma Hamma) 4. Skokomish River
North Olympic South Olympic Skokomish Lowland Delineated 26 river and stream basins and 24 shoreline catchments that include small streams
Streamflow, in cubic feet per second Drainage area, in square miles Streamflow and Drainage Area for Rivers and Streams Draining to Hood Canal Streamflow, in cubic feet per second Drainage area, in square miles Annual mean streamflow, various years of record Mean streamflow, 1971-2002 Preliminary, subject to revision
Streamflow Estimates for Ungaged Rivers and Streams • Lowland rivers and streams Qsw = 2.8 A 1.04 • North Olympic rivers and streams Qsw = 0.9 A 1.27 Qsw = Mean streamflow for 1971 – 2002 in cubic feet per second. A = Drainage area in square miles. Preliminary, subject to revision
Mean Streamflow for 1971-2002 River or stream Mean streamflow (cfs) Shoreline catchments Mean streamflow (cfs) Anderson 1 14 Anderson 2 19 Shore 1 20 Big Beef 38 USGS gage 12069550 Shore 2 6 Big Quilcene 193 USGS gage 12052500 Shore 3 17 Dewatto 73 Shore 4 13 Dosewallips 618 USGS gage 12053000 Shore 5 9 Duckabush 483 USGS gage 12054000 Shore 6 10 Eagle 24 Shore 7 28 Finch 10 Shore 8 2 Fulton 26 Shore 9 52 Hamma Hamma 578 USGS gage 12054500 Shore 10 956 (includes Lake Cushman) Jackson 3 Shore 11 22 Jorsted 14 Shore 12 3 Lilliwaup 50 Shore 13 5 Little Quilcene 88 Shore 14 2 Mission 38 Shore 15 1 Rendsland 27 Shore 16 19 Seabeck 17 Shore 17 8 Skokomish 1276 USGS gage 12061500 Shore 18 12 Spencer 5 Shore 19 3 Stavis 30 Shore 20 5 Tahuya 152 Shore 21 10 Tarboo 21 Shore 22 19 Thorndyke 22 Shore 23 11 Union 82 Shore 24 2 Waketickeh 23 Preliminary, subject to revision
Monthly Distribution of Streamflow Preliminary, subject to revision
Nitrogen Concentrations • Water-quality records were available for 9 rivers and streams. • Records span from 1959 to 2002. • Number of samples vary from 12 (Tahuya and Union Rivers) to 311 (Skokomish River). • Combined NH3, NO2, and NO3, reported as mg N per liter. • Concentrations of total nitrogen were approximately 23 percent more than the concentrations of inorganic nitrogen.
Inorganic nitrogen concentrations and streamflow Data sources: WA Department of Ecology, USEPA, and USGS
Inorganic nitrogen concentrations and streamflow Data sources: WA Dept. of Ecology, USEPA, and USGS
Streamflow - Nitrogen Concentration Relations Streamflow and total inorganic nitrogen data were log-transformed and linear regressions performed on the data sets to calibrate the general equation [N] = B Qsw C for each river where nitrogen data were available. Olympic rivers B C [N] for mean streamflow Big Quilcene 0.03 0.16 0.08 Dosewallips 0.001 0.62 0.07 Duckabush 0.01 0.11 0.02 Hamma Hamma 0.01 0.23 0.05 Skokomish 0.03 0.17 0.09 Lowland rivers and streams Finch 0.07 0.20 0.12 Dewatto 0.05 0.16 0.10 Tahuya 0.06 0.16 0.13 Union 0.13 0.25 0.40 Used median values to calculate nitrogen concentra- tions for other rivers and streams: [N] = 0.03 Q 0.17 Preliminary, subject to revision
Surface-Water/Nitrogen-Load Calculations • Used monthly mean discharge and nitrogen-flow relations to calculate monthly loads for each river, stream, and shore catchment. • Aggregated monthly loads to calculate annual loads. • Direct discharges to Hood Canal including point sources, stormwater, and septic effluent from shoreline residences were not included.
Ground-Water-Load Calculations: Flow Mass balance used to calculate ground-water flow: Qgw = Precipitation – Qsw –Evapotranspiration Precipitation for each river and stream basin was estimated from NRCS/NWS map. Potential (maximum) evapotranspiration was assumed to be 20 inches per year.
Ground-Water-Load Calculations: Nitrate Concentration Median concentration of NO3 for wells in the Washington Department of Health (DOH) data base for WRIAs 14-17 was 0.2 mg/L as N. For Hood Canal load calculations, the concentration of inorganic nitrogen in ground water was assumed to be 0.3 mg/L to account for a greater proportion of shallow ground water than represented by the DOH data set. Preliminary, subject to revision
Annual Inorganic Nitrogen Loads to Hood Canal from Surface and Ground Water Rivers and streams: 421 + 162 metric tons per year Regional Ground Water: 56 + 30 metric tons per year Total (not including direct inputs): 477 + 192 metric tons per year Preliminary, subject to revision
Distribution of Surface- and Ground-Water Load to Rivers and Streams Draining into Hood Canal Preliminary, subject to revision
Comparison to Previous USGS Estimates of N Loads Water-Resources Investigations Report 97-4270 (Embrey and Inkpen (1998) provided estimates of annual inorganic nitrogen loads for five rivers draining to Hood Canal. Two reasons likely account for differences with current estimates: 1) their data set ended with samples collected in 1993 and 2) loads were based on concentrations of individual samples (except for the Skokomish) and were not normalized for a common time period. Phase I (2004) Embrey and Inkpen (1998) River metric tons per year Dosewallips 41 43* Duckabush 10 25* Hamma Hamma 29 41* Skokomish 106 155 Dewatto 7 13* *Potential for large error in load was noted by Embrey and Inkpen for these sites. Preliminary, subject to revision
Nitrogen Loads from Near-Shore Septic Systems Raegan Huffman U.S. Geological Survey Tacoma, WA
Nitrogen Loads From Near-Shore Septic Systems Premise: Effluent from near-shore septic systems does not recharge the regional ground-water systems but seeps directly into Hood Canal. Objective: Estimate the nitrogen load from near-shore septic systems.
Approach for Estimating Nitrogen Load from Near-Shore Septic Systems LOAD = PER CAPITA EFFLUENT VOLUME X CONCENTRATION of N X POPULATION • PER CAPITA VOLUME: 60 + 20 gals person-1 day-1 • CONCENTRATION OF TOTAL N in septic tank effluent: 55 + 30 mg/L • 10 pounds of N person-1 year-1 is total waste stream delivered to septic system
Approach for Estimating Nitrogen Load from Near-Shore Septic Systems (cont.) • Ammonia (NH3) is 75% of total N in septic effluent, 25% is organic N, which is retained in the tank and drain field. • In aerated, sandy soils, there is complete nitrification of NH3 in effluent to NO3. • In practice, there is some denitrification and loss of gaseous N2. 10 percent denitrification of total N is assumed here. • 35% (+ 10%) of total N retained in soil as organic N or volatilized as nitrogen.
Approach for Estimating Nitrogen Load from Near-Shore Septic Systems (cont.) Resulting per capita loading rate: 65% of 10 lbs NO3 = 6.5 lbs NO3 as N per person per year Preliminary, subject to revision
Approach for Estimating Near-shore Population of Hood Canal Average water-front lot extends 150 m up from the water. Estimate population for a 150 m buffer around the shoreline of Hood Canal. Account for full-time and seasonal residents.
Lynch Cove 2000 Census Population Data – used to estimate full-time population
Lynch Cove 2000 Census Housing Unit Data - used to estimate seasonal population
Near-Shore Population of Hood Canal County Population Housing Units Jefferson 1,404 1,221 Kitsap 2,276 968 Mason 2,738 2,6786,400 people 4,900 units Population October to May - 6,400 people. June to September – 12,000 people (assuming an occupancy of 2.5 people per unit). ~ ~ Preliminary, subject to revision
Nitrogen Loads From Near-Shore Septic Systems Hood Canal • 28 metric tons + 15 metric tons including seasonal residents, 20 + 11 metric tons is from full-time residents Lynch Cove • 8 + 5 metric tons including seasonal residents, 5 + 3 metric tons from full-time residents Preliminary, subject to revision
Nitrogen Loads From Atmospheric Sources Anthony J. Paulson U.S. Geological Survey Tacoma, WA
Direct Atmospheric Deposition Atmospheric loading is calculated from: • Marine surface area (111 square miles) and • Nitrogen Deposition: a) Hoh Ranger Station = 1.03 kg N per hectare b) LaGrande = 1.04 kg N per hectare c) North Cascades= 1.65 kg N per hectare d) Tahoma Woods= 0.68 kg N per hectare
Atmospheric Loading Using Hoh Ranger Station data, total N loading: To Hood Canal is 30 ± 11 metric tons of N per year To Lynch Cove is 4.4 ± 1.6 metric tons of N per year
Comparison of Land Sources PSAT - Human sewage, agriculture manure, 50% stormwater runoff, and forestry: 64 to 280 metric tons Atmospheric loading to land (using Hoh Ranger Station data): 192 to 351 metric tons PSAT plus atmospheric: 256 to 631 metric tons USGS - Streams, ground water, and near-shore septic- 302 to 716 metric tons Preliminary, subject to revision
Nitrogen Loads From Marine Sources Anthony J. Paulson U.S. Geological Survey Tacoma, WA
The boundary for the calculation of marine inputs of nitrogen is near the South Point-Lofall sill.
Marine Inputs of Nitrogen to Hood Canal Marine inputs were calculated using: 1) NO3 concentrations seaward of the South Point-Lofall sill and; 2) Net landward transport of water in the lower layer over the sill.
Nitrogen Concentrations in Hood Canal, August 1986(Paulson and others, 1993) Nitrate concentrations seaward of the sill (station 8) were 0.28 ± 0.01 mg/L as N (19.7 ± 0.6 μM/L)
Estimates of Net Landward Transport of Water in the Lower Layer over the Sill Cokelet and others, 1990 – using calculations from the mass balance of water and salt: 1,500 - 3,600 m3/s. Warner and others, 2002 – using calculations from changes in chlorofluorocarbons: 890 - 3,280 m3/s. Ebbesmeyer and others, 1984 - showed that net transport of water decreased to 1000 m3/s near Eldon.
Marine Inputs of Nitrogen to Hood Canal Estimates of the flux of marine nitrate over the South Point-Lofall sill range between 8,700 and 31,200 metric tons per year. Caution: The marine flux is highly dependent on the placement (seaward extent) of the boundary of the study area. Preliminary, subject to revision
Estimates of Other Sources of Nitrogen to Hood Canal(from PSAT) Direct Point Discharges: .3 – 2.7 metric tons of N/yr Chum Salmon Carcass Disposal: 15 – 22 metric tons of N/ year
Summary of Nitrogen Loads into Hood Canal Anthony J. Paulson U.S. Geological Survey Tacoma, WA
Inputs of Nitrogen into Hood Canal and Lynch Cove, in Metric tons N per Year Hood Canal Lynch Cove Rivers and Streams 421+162 64+25 Regional Ground Water 56+30 7+4 Near-Shore Septic Systems 28+15 8+5 Atmospheric 30+11 4.4+1.6 Other Sources 20+5 1.5+1.2 Marine 8,700-31,200 ??? Preliminary, subject to revision
Inputs Of Nitrogen into Hood Canal • The large input of nutrients is a result of the large input of seawater (i.e. flushing) in the northern part of Hood Canal. • The more extensive flushing in Northern Hood Canal is not inconsistent with the lack of a dissolved oxygen problem there. • The input of marine nutrients at other landward points along in Hood Canal (such as into Lynch Cove), is unknown at this time.
Estimated monthly inorganic nitrogen load to all ofHood Canal, excluding marine inputs. Preliminary, subject to revision
Estimated monthly inorganic nitrogen loads to Lynch Cove, excluding marine inputs. Preliminary, subject to revision
Proposed Focus Studies • Relate nitrogen concentrations to land useWill help to better understand how land use affects nitrogen inputs from rivers to Hood Canal • Conduct studies in three basins – Skokomish, Union, and other basin(s) discharging into Lynch Cove. • Collect samples along the length of the rivers at 8-10 points where land use changes. • Look at nutrient concentrations, nitrogen isotopes • One sampling effort, in the summer during low flow.