Download

1 / 13
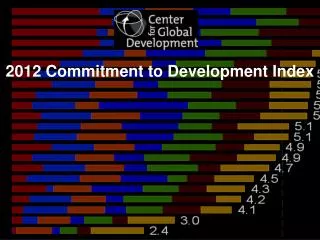
130 likes | 448 Views
Hospitals Demonstrate Commitment to Quality Improvement October 2012. Quality improvement can be viewed as a five-step process. Chart 1: Five Steps to Improving Quality. Source: Analysis by Avalere Health and American Hospital Association.

E N D
Hospitals Demonstrate Commitment to Quality ImprovementOctober 2012
Quality improvement can be viewed as a five-step process. Chart 1: Five Steps to Improving Quality Source: Analysis by Avalere Health and American Hospital Association.
Hospitals engage with government agencies and non-governmental bodies on quality improvement. Chart 2: Sample of Hospital Quality Improvement Partners and Entities National Quality Forum The Joint Commission Centers for Disease Control and Prevention Disease Groups (e.g., American Heart Association) Agency for Healthcare Research and Quality Private Payers Centers for Medicare & Medicaid Services Professional Societies Health Resources and Services Administration Quality Improvement Initiatives Institute for Healthcare Improvement Department of Veterans Affairs Premier/ VHA/ Group Purchasing Organizations Department of Health and Human Services Health Research and Educational Trust Partnership for Patients Public Health Agencies Regional Collaboratives States Source: Analysis by Avalere Health and American Hospital Association.
National quality campaigns have improved hospital delivery of cardiac care. • Chart 3: Percentage of Patients Undergoing Percutaneous Coronary Interventions within 90 Minutes of Arrival at a Hospital, 2007 – 2011 Source: The Joint Commission. Improving America’s Hospitals: The Joint Commission’s Annual Report on Quality and Safety 2012.
Evidence-based protocols have improved quality in intensive care units (ICUs). Chart 4: CLABSIs per 1,000 Central Line Days at Hospitals Participating in Michigan Hospital Association (MHA) Keystone: ICU, 2004 – 2009 Source: MHA Keystone Center for Patient Safety & Quality. 2010 Annual Report.
Hospitals have progressed in combating hospital-acquired infections… Chart 5: Central Line-associated Bloodstream Infection (CLABSI) Standardized Infection Ratio (SIR), 2006 – 2010 Source: U.S. Department of Health and Human Services. Health System Measurement Project. Central Line-Associated Bloodstream Infection Standardized Infection Ratio. Note: SIR is a ratio of the observed number of CLABSI as reported to CDC's National Healthcare Safety Network (NHSN) each year to the predicted occurrence based on the rates of infections among all facilities reporting to NHSN during the referent period (January 2006 through December 2008). SIR below 1.0 means hospitals reported fewer infections than predicted.
…and in adhering to accepted treatment protocols. Chart 6: Adult Surgery Patients Who Received Appropriate Timing of Antibiotics, by Age, 2005 – 2009 Source: U.S. Department of Health and Human Services. (2011). National Healthcare Quality Report. Washington, DC: Agency for Healthcare Research and Quality.
Hospital efforts to curb infections have produced impressive results. Chart 7: Percentage of On the CUSP: Stop BSI Intensive Care Units (ICUs) with Zero Percent Central Line-associated Bloodstream Infection (CLABSI) Rate Intervention 12 Months Before Intervention 1-3 Months Post Intervention 4-6 Months Post Intervention 7-9 Months Post Intervention 10-12 Months Post Intervention Source: Agency for Healthcare Research and Quality. CLABSI Update. http://www.ahrq.gov/qual/clabsiupdate/clabsiupdate.pdf. Note: To achieve a zero percent CLABSI rate, an ICU had to report no CLABSIs for each data point submitted during the period.
Collaboration to develop and implement multiple interventions across a system can yield quality gains. Chart 8: Unadjusted Mortality Decline and Case-mix Index in Hospitals in the Ascension Health System, 2004 – 2010 Source: Pryor, D., et al. (April 2011). The Quality ‘Journey’ At Ascension Health: How We’ve Prevented At Least 1,500 Avoidable Deaths A Year—And Aim To Do Even Better. Health Affairs, 30(4): 604-611.
Broad dissemination of quality improvement successes can improve outcomes across a hospital system. Chart 9: System-wide Infection Counts at Legacy Health, 2008 and 2010 Source: Joyce, J., et al. (2011). Legacy Health's 'Big Aims' Initiative To Improve Patient Safety Reduced Rates Of Infection And Mortality Among Patients. Health Affairs, 30(4): 619-627.
More hospitals are adhering to accepted surgery care guidelines. Chart 10: Rate of Adherence to Surgical Care Improvement Project (SCIP) Process Measures, Fiscal Years (FY) 2008 and 2009 Rate of Adherence Source: Centers for Medicare and Medicaid Services. Progress Toward Eliminating Healthcare-Associated Infections – September 23-24, 2010. http://www.hhs.gov/ash/initiatives/hai/actionplan/cms_scip.pdf.
Hospitals are advancing on evidence-based quality measures. Chart 11: Percentage of Hospitals Achieving Composite Rates Greater Than 90 Percent for Accountability Measures, 2007 and 2011 Percentage of Hospitals Source: The Joint Commission. Improving America’s Hospitals: The Joint Commission’s Annual Report on Quality and Safety 2012.
Hospitals’ quality initiatives are yielding better patient outcomes. Chart 12: Inpatient Deaths per 1,000 Adult Hospital Admissions with Heart Attack, by Age, 2000 – 2008 Source: U.S. Department of Health and Human Services. (2011). National Healthcare Quality Report. Washington, DC: Agency for Healthcare Research and Quality.