Download

1 / 38
400 likes | 446 Views
Explore the intricate relationship between population dynamics, carrying capacity, and human impact on ecosystems. Learn about factors affecting population size, growth patterns, and the role of predation. Discover the consequences of human activities on the environment and strategies for managing population growth.

E N D
Population Dynamics, Carrying Capacity, and Human Population Brian Kaestner Saint Mary’s Hall Thanks to Miller and Clements
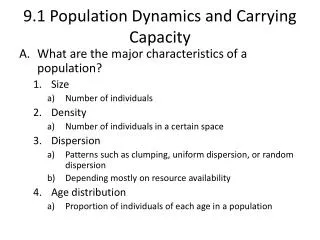
Population Dynamics and Carrying Capacity • Population dynamics • Zero population growth (ZPG) • Biotic potential (intrinsic rat of increase [r]) • Environmental resistance • Carrying capacity • Minimum viable population (MVP)
Population Dispersion Clumped (elephants) Uniform (creosote bush) Random (dandelions) Fig. 9.2, p. 199
Factors Affecting Population Size POPULATION SIZE Growth factors (biotic potential) Decrease factors (environmental resistance) Abiotic Abiotic Too much or too little light Temperature too high or too low Unfavorable chemical environment (too much or too little of critical nutrients) Favorable light Favorable temperature Favorable chemical environment (optimal level of critical nutrients) Biotic Biotic High reproductive rate Generalized niche Adequate food supply Suitable habitat Ability to compete for resources Ability to hide from or defend against predators Ability to resist diseases and parasites Ability to migrate and live in other habitats Ability to adapt to environmental change Low reproductive rate Specialized niche Inadequate food supply Unsuitable or destroyed habitat Too many competitors Insufficient ability to hide from or defend against predators Inability to resist diseases and parasites Inability to migrate and live in other habitats Inability to adapt to environmental change Fig. 9.3, p. 200
K Population size (N) Population size (N) Time (t) Time (t) Exponential Growth Logistic Growth 2.0 2,000 1.5 1,500 Number of sheep (millions) 1.0 1,000 .5 500 1800 1825 1850 1875 1900 1925 1910 1920 1930 1940 1950 Exponential and Logistic Growth Fig. 9.4, p. 201 Number of reindeer Year Year Fig. 9.5, p. 201 Fig. 9.6, p. 201
Population Density Effects • Density-independent controls • Density-dependent controls
Irregular Stable Number of individuals Cyclic Irruptive Time Natural Population Curves Fig. 9.7, p. 202
160 140 Hare 120 Lynx 100 Population size (thousands) 80 60 40 20 0 1845 1855 1865 1875 1885 1895 1905 1915 1925 1935 Year The Role of Predation in Controlling Population Size • Predator-prey cycles • Top-down control • Bottom-up control Fig. 9.8, p. 203
r-Selected Species K-Selected Species cockroach dandelion elephant saguaro Many small offspring Little or no parental care and protection of offspring Early reproductive age Most offspring die before reaching reproductive age Small adults Adapted to unstable climate and environmental conditions High population growth rate (r) Population size fluctuates wildly above and below carrying capacity (K) Generalist niche Low ability to compete Early successional species Fewer, larger offspring High parental care and protection of offspring Later reproductive age Most offspring survive to reproductive age Larger adults Adapted to stable climate and environmental conditions Lower population growth rate (r) Population size fairly stable and usually close to carrying capacity (K) Specialist niche High ability to compete Late successional species Reproductive Patterns and Survival • r-selected species • Asexual reproduction • K-selected species • Sexual reproduction Fig. 9.10b, p. 205
100 10 Percentage surviving (log scale) 1 0 Age Survivorship Curves Fig. 9.11, p. 206
Human Impacts on Ecosystems • Habitat degradation and fragmentation • Ecosystem simplification • Genetic resistance • Predator elimination • Introduction of non-native species • Overharvesting renewable resources • Interference with ecological systems
Environmental Stress Organism Level Population Level Population Level Disruption of energy flow through food chains and webs Disruption of biogeochemical cycles Lower species diversity Habitat loss or degradation Less complex food webs Lower stability Ecosystem collapse Physiological changes Psychological changes Behavior changes Fewer or no offspring Genetic defects Birth defects Cancers Death Change in population size Change in age structure (old, young, and weak may die) Survival of strains genetically resistant to stress Loss of genetic diversity and adaptability Extinction Fig. 9.12, p. 208
Key Concepts • Factors affecting human population size • Human population problems • Managing population growth
Average crude birth rate Average crude death rate World 22 9 All developed countries 11 10 All developing countries 25 9 Developing countries (w/o China) 29 9 Fig. 11.2a, p. 239
Africa 38 14 Latin America 24 6 Asia 22 8 Oceania 18 7 United States 15 9 North America 14 9 Europe 10 11 Fig. 11.2b, p. 239
Population Change = (Births + Immigration) – (Deaths + Emigration) Factors Affecting Human Population Size • Population change equation • Zero population growth (ZPG) • Crude birth rate (BR) • Crude death rate (DR) Refer to Fig. 11-2 p. 239
Annual world population growth <1% 1-1.9% 2-2.9% 3+% Data not available Natural Rate of Increase Fig. 11.3, p. 240
Asia 3.7billion 4.7 billion Europe 728 million 714 million Africa 800 million 1.3 billion Latin America 518 million 703 million North America 306 million 374 million Oceania 31 million 39 million Fig. 11.6, p. 241 2000 2025
China 1.26 billion 1.4 billion India 1 billion 1.4 billion USA 276 million 338 million Indonesia 212 million 273 million Brazil 170 million 221 million Pakistan 151 million 227 million Russia 145 million 137 million Bangladesh 128 million 177 million Japan 127 million 121 million Nigeria 123 million 205 million Fig. 11.5, p. 241 2000 2025
Births per woman < 2 4-4.9 2-2.9 5+ No Data 3-3.9 Fertility Rates • Replacement-level fertility • Total fertility rate (TFR) Fig. 11.8, p. 242
World 5 children per women 2.9 Developed countries 2.5 1.5 Developing countries 6.5 3.2 Africa 6.6 5.3 Latin America 5.9 2.8 Asia 5.9 2.8 Oceania 3.8 2.4 North America 3.5 2.0 Europe 2.6 1.4 Fig. 11.7, p. 241 2000 1950
Stage 1 Preindustrial Stage 2 Transindustrial Stage 3 Industrial Stage 4 Postindustrial High 80 70 60 Birth rate 50 Birth rate and death rate (number per 1,000 per year) Relative population size 40 30 Death rate 20 10 Total population Low 0 Low growth rate Increasing Growth growth rate Very high growth rate Decreasing growth rate Low growth rate Zero growth rate Negative growth rate Time The Demographic Transition Fig. 11.26, p. 255
32 30 28 26 24 Births per thousand population 22 20 World War II 18 Demographic transition 16 Depression 14 Baby bust Baby boom Echo baby boom 0 1910 1920 1930 1940 1950 1960 1970 1980 1990 2000 2010 Year Factors Affecting BR and TFR • See bulleted list in text p. 243 • US BR’s and TFR’s Fig. 11.11, p. 243 see Fig. 11-10 p. 243
12 11 High High 10.7 10 Medium Low 9 Medium 8.9 8 Population (billion) 7 6 Low 7.3 5 4 3 2 1950 1960 1970 1980 1990 2000 2010 2020 2030 2040 2050 Fig. 11.9, p. 242 Year
4.0 3.5 3.0 2.5 Births per woman 2.1 2.0 1.5 1.0 0.5 0 1920 1930 1940 1950 1960 1970 1980 1990 2000 2010 Year Fig. 11.10, p. 243
Infant deaths per 1,000 live births <10 <10-35 <36-70 <71-100 <100+ Data not available Factors Affecting DR • Life expectancy • Infant mortality rate (IMR) Fig. 11.14, p. 246
Rate of natural increase = crude birth rate = crude death rate Developed Countries Developed Countries 50 50 Crude birth rate Rate of natural increase 40 40 Rate of natural increase Crude birth rate Rate per 1,000 people 30 Rate per 1,000 people 30 Crude death rate 20 20 Crude death rate 10 10 Year Year 0 0 1800 2000 1775 1850 1900 1950 2050 1800 2000 1775 1850 1900 1950 2050 Factors Affecting Natural Rate of Increase Fig. 11.13, p. 245
Male Female Rapid Growth Guatemala Nigeria Saudi Arabia Slow Growth United States Australia Canada Zero Growth Spain Austria Greece Negative Growth Germany Bulgaria Sweden Ages 0-14 Ages 15-44 Ages 45-85+ Population Age Structure Fig. 11.16a, p. 247
Solutions: Influencing Population Size • Migration • Environmental refugees • Reducing births • Family planning • Empowerment of women • Economic rewards and penalties
Case Study: Slowing Population Growth in India Generally disappointing results: • Poor planning • Bureaucratic inefficiency • Low status of women • Extreme poverty • Lack of support
Case Study: Slowing Population Growth in China Generally positive results: • Economic incentives • Free medical care • Preferential treatment • Intrusive and coercive • Locally administered
Cutting Global Population Growth • Family planning • Reduce poverty • Elevate the status of women