Download

1 / 9
90 likes | 107 Views
This study aims to validate spectral element simulations of blood flow in intracranial aneurysms by comparing the concentration field calculated in vitro with patient-specific arterial geometry and CT images from in vivo dye injection.

E N D
Yue Yu Validation of Blood Flow Simulations in Intracranial Aneurysms Brown University
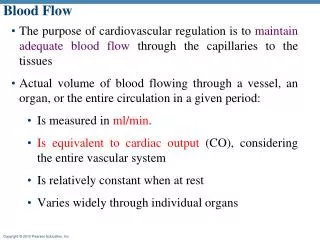
By comparing the concentration field (calculated in vitro with patient-specific arterial geometry) and the CT images (from in vivo dye injection), we aim to validate our spectral element simulations. The complex geometry of aneurysms may cause instabilities in velocity field (Lighthill)*. We will investigate if the concentration field can also reveal this phenomenon. Objective *H. Baek, M. V. Jayaraman, P.D. Richardson, and G. E. Karniadakis. Flow instability and wall shear stress variation in intracranial aneurysms. J Roy Soc Interface, 7:967-988, 2010.
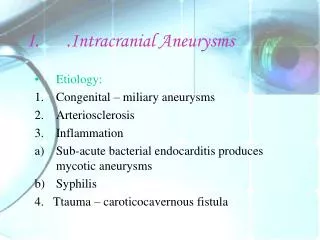
Dye Injection in Intracranial Trees • Dye can be used to mark and visualize particular regions of flow or individual fluid streamlines. • The contrast agent is iodixanol. The change in signal intensity should be proportional to its concentration. Aneurysm Right Internal Carotid Artery (RICA)
Data for Reconstructing Arterial Geometry 1.With contrast 2.Without contrast 3.Subtract 1 from 2 Slice set 28 Slice set 128 *This set of data are static CT images taken from 173 different angles, and they will be used for structural reconstruction
Angiograms of Dye Injection (Data for Comparison) After subtracting the static background from the angiograms (as in the last slice): T=1.72 (sec) T=0.22 (sec) T=0.72 (sec) T=1.22 (sec) *The frame rate is 2 images per second, and the injection of contrast begins at T=0.0 and ends at T=1.0. The idea is to simulate the contrast concentration numerically and compare it with these dye images.
Steps to the Goal • Construct arterial geometry from the patient-specific CT data • Tools: Matlab (segmentation), Amira (smoothing), Gridgen • (generating mesh) Simulate the concentration of contrast for blood flow in the given geometry. Tools: Nektar (High order finite element method solver) 2 weeks <1 week Compare the results with clinical angiograms both qualitatively and quantitatively. Tools: Matlab (registration) 2 weeks
Steps to the Goal: Segmentation • Get signal density information for every voxels with filtered back-projection. • Setting appropriate threshold for each 2D slice manually (because the sizes of arteries vary a lot, the threshold might vary slice by slice), then reconstruct the 3D arterial geometry by interpolating between these slices.
Steps to the Goal: Registration • For every iteration of the registration algorithm a 3D rigid-body geometric transform is applied to the CT volume to produce a change in the 3D position of the arteries. The 3D volume is then reduced to a 2D digitally reconstructed radiograph (DRR) by summing the voxel values of the transformed CT volume in the z direction. • Assume pixel values of the filtered DRR are denoted by Iiand pixel values of the filtered fluoroscopy frame are denoted by Ri, by minimizing the objective function where and is the histogram bin which includes Ri.
References • Juan R. Cebral, Alessandro Radaelli, Alejandro Frangi, and Christopher M. Putman, Qualitative Comparison of Intra-aneurysmal Flow Structures Determined from Conventional and Virtual Angiograms, Medical Imaging 2007: Physiology, Function, and Structure from Medical Images. • Matthew D. Ford, Gordan R. Stuhne, Hristo N. Nikolov, Damiaan F. Habets, Stephen P. Lownie, David W. Holdsworth, and David A. Steinman, Virtual Angiography for Visualization and Validation of Computational Models of Aneurysm Hemodynamics, IEEE Transactions on Medical Imaging, Vol. 25, No. 12, 2005. • M. Pickering, A. Muhit, J. Scarvell, and P. Smith, A new multimodalsimilarity measure for fast gradient-based 2D-3D imageregistration, in Proc. IEEE Int. Conf. on Engineering in Medicineand Biology (EMBC), Minneapolis, USA, 2009, pp. 5821-5824. Thank you!