Graphing Rational Functions Example #1
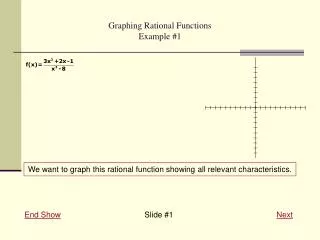
Graphing Rational Functions Example #1. We want to graph this rational function showing all relevant characteristics. End Show Slide # 1 Next. Graphing Rational Functions Example #1. First we must factor both numerator and denominator, but don’t reduce the fraction yet.

Graphing Rational Functions Example #1
E N D
Presentation Transcript
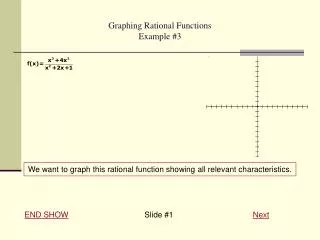
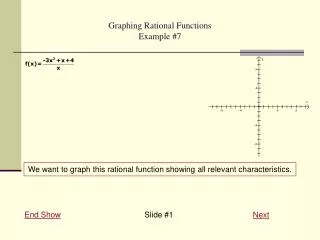
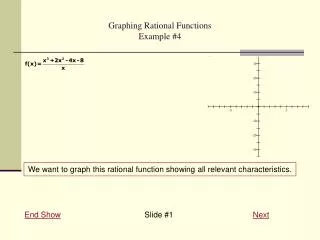
Graphing Rational FunctionsExample #1 We want to graph this rational function showing all relevant characteristics. End Show Slide #1Next
Graphing Rational FunctionsExample #1 First we must factor both numerator and denominator, but don’t reduce the fraction yet. Numerator: Factors to 2 binomials. Denominator: Factors as the difference of 2 cubes. Previous Slide #2Next
Graphing Rational FunctionsExample #1 Note the domain restrictions, where the denominator is 0. For the quadratic factor, the discriminant is 2^2-4(1)(4)=-12. Thus, it is 0 only at imaginary numbers and for this problem we are only interested in the real numbers. Previous Slide #3Next
Graphing Rational FunctionsExample #1 Now reduce the fraction. In this case, there are no common factors. So it doesn't reduce. Previous Slide #4Next
Graphing Rational FunctionsExample #1 Any places where the reducedform is undefined, the denominator is 0, forms a vertical asymptote. Remember to give the V. A. and the full equation of the line and to graph it as a dashed line. Previous Slide #5Next
Graphing Rational FunctionsExample #1 Any values of x that are not in the domain of the function but are not V.A. form holes in the graph. In other words, any factor that reduced completely out of the denominator would create a hole in the graph where it is 0. Since this example didn't reduce, it has no holes. Previous Slide #6Next
Graphing Rational FunctionsExample #1 Next look at the degrees of both the numerator and the denominator. Because the denominator's degree, 3, is larger than the numerator's, 2, the line y=0 is automatically the horizontal asymptote and there is no oblique asymptote. Previous Slide #7Next
Graphing Rational FunctionsExample #1 Since the H.A. is the x-axis, the intersections with the H.A. are also the x-intercepts. We find the x-intercepts by solving when the function is 0 which would be when the numerator is 0. Thus, when 3x-1=0 and x+1=0. Previous Slide #8Next
Graphing Rational FunctionsExample #1 Now find the y-intercept by plugging in 0 for x. Previous Slide #9Next
Graphing Rational FunctionsExample #1 Plot any additional points needed. Here I only plotted one more point at x=4 since a point hadn't been plotted to the right of the V.A. You can always choose to plot more points than required to help you find the graph. Previous Slide #10Next
Graphing Rational FunctionsExample #1 Finally draw in the curve. For the part to the right of the V.A., we use that it can't cross the x-axis and it has to approach the V.A. and the H.A., the x-axis. Previous Slide #11Next
Graphing Rational FunctionsExample #1 For -1<x<2, we use the x-intercepts, the y-intercepts and the fact that the multiplicity of the x-intercept 1/3 is 1 to know that the graph crosses the x-axis at 1/3. Thus, the graph has to approach the V.A. from the left going to negative infinity. Previous Slide #12Next
Graphing Rational FunctionsExample #1 Finally for x<-1, again the multiplicity is 1 for the x-intercept at x=-1. So the graph will cross the x-axis again. Also, the graph must approach the H.A., the x-axis, as the graph goes out to the left. Previous Slide #13Next
Graphing Rational FunctionsExample #1 Lastly if at any point you are unsure if the graph is above or below the x-axis based on multiplicity, just plot a point where you are unsure. For example, if you weren't sure where the graph is for 1/3<x<2, plot the point when x=1 to show you the graph is below the x-axis there. Previous Slide #14End Show