Download
1 / 23
230 likes | 247 Views
Learn how to leverage Variation-Based Metrics to enhance your Balanced Scorecard performance analysis and take impactful actions. Discover the power of Continuous Variables for in-depth insights and improved strategies in this detailed guide.

E N D
Supercharge Your Balanced Scorecard Using Variation-based Metrics Mike Hyzy August 2001
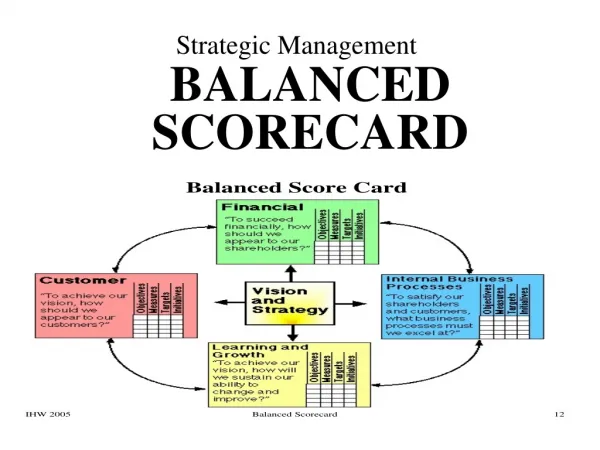
How to Tie Together? • Balanced Scorecard • Tool for measuring implementation of strategic plan • 4 ‘Balanced’ perspectives: Financial, Customer, Process, Learning & Innovation • Good at identifying metrics to keep focus on long-term objectives and strategy implementation • BUT, poor providing method for analyzing data and taking action • Six Sigma • Method for reducing defects and delivering financial benefits • Focus on customer voice, financial impact, variation/defects • Good at dramatically improving processes and delivering financial return • BUT, often not integrated into corporate strategy • Variation-based Metrics • Powerful approach of applying Six Sigma statistical tools to the Balanced Scorecard NCR Confidential
Tools for Understanding Variation Variation Based Metrics • Variation Based Metrics (VBMs) are presentations of metrics which allow you to look for patterns in the data • Typically done in two ways: Patterns over TimePatterns not related to Time Run charts Frequency Plots (Histogram) Control Charts: Pareto Charts Individual Charts P, C, U Charts Others Control Charts They help us distinguish between routine variation (common cause) and exceptional variation (special cause) NCR Confidential
Limitations of Mean-Based Metrics • Be careful of mean-based metrics • Seen in typical monthly reports • Example: • 2 departments delivering product to customers • On the monthly report, they both appear the same (avg = 50) • If you were the customer, would you view them both as the same??! • No comparison between 2 values can be global; data has no meaning apart from their context • Comparisons to beware of: • Monthly averages • Variance from target • YTD values • YTD variance • Variance from same month last year NCR Confidential
Limitations of Mean-Based Metrics (Today’s Scorecards) • Any comparisons are LIMITED • Can’t identify patterns or trends • Plans and targets represent the Voice of the Customer(we hope)… not the Voice of the Process • Actions based on this data may be FLAWED • Single points give no indications of the SHAPE, CENTERor SPREAD • Our customers feel and rememberVARIATION, not AVERAGES On AVERAGE He’s Comfortable!! NCR Confidential
Continuous vs. Discrete Data • Continuous Variables are Preferable • Whenever possible, or when given the choice… select/gather continuous variables! • Crucial to consider during data collection planning when flexibility exists to identify and/or define various types of metrics to track for a project • Continuous variables are more “information rich” • Discrete variables capture only yes/no, met/not met, etc. • Continuous variables also capture “by how much” • More flexibility in the use of analysis tools w/ continuous variables • Unfortunately, the tendency with many companies has been to utilize discrete variables • Discrete are usually more easy to define and easier to measure • Majority of Balanced Scorecard metrics in prior years have been discrete NCR Confidential
Continuous vs. Discrete Example • Example: On-time delivery… Approach #1: • Discrete: Capture Yes or No (1 or 0) as to whether delivery was made on time • Summarized by calculating % deliveries that were delivered on-time • BUT, using this approach we have NO IDEA by HOW MUCH we missed the target for those deliveries that were NOT on-time • Did we miss most deliveries by a few hours or a few weeks??? • NO WAY to determine performance at different target levels, since the target is ‘baked into’ the met/not met determination Week 1 of Reporting Period Target % On Time Delivery = 60% (3 of 5) Met target of 70% On-time Deliveries during 17% of the reporting periods (months) Can’t tell by how much we missed the delivery target! NCR Confidential
Continuous vs. Discrete Example • Example: On-time delivery… Approach #2: • Continuous: Capture delta time (say, hours) from targeted delivery time • Can now determine BY HOW MUCH we missed our deliveries • Can determine On-time delivery performance at varying target levels • What percentage were delivered no more than 1 day late? • Allows you to identify a lower specification limit as well, since very often the customer would consider it a defect if we delivered too early (they may not be ready or available) • The bottom line… select continuous variables whenever possible! Target Range Target Week 1 of Reporting Period OR % On Time Delivery = 60% (3 of 5) 16% of deliveries were on time or early 22% of deliveries were between 3 days early and 2 days late NCR Confidential
Matching Action to the Type of Variation • Understanding Variation is key • Actions taken are dependent upon the type of variation that exists • Taking the wrong action may make the process worse NCR Confidential
Why Does It Matter? • Want to Avoid: • Missing signals • Not taking action when action is appropriate • Misreading noise for a signal of a change • Wasting time from taking action when none is appropriate • TAMPERING!! NCR Confidential
What happened? I’ll go find out. What’s going on? I’m looking! I’m looking! I’m looking Tampering Drives the Search for Answers… But there aren’t any!! The Big Gear Turns The Big Gear Turns A Notch And The Little Gears Whirl In A Frenzy Trying To Keep Up NCR Confidential
Variance Based Metric Example: Executable Orders • QUESTION: What Action Should You Take??? • NCR Leadership Team Report • Detailed Process Report NCR Confidential
Variance Based Metric Example Executable Orders • Now what action should you take??? • Red/Yellow/Green color-coding based upon variance from target • 1 problem… where does the 2% value come from??? • Is this level of variance an appropriate threshold for action??? • One would assume that RED bars indicate a SERIOUS PROBLEM and YELLOW bars indicate a POTENTIAL PROBLEM • Looks like you should be acting almost EVERY MONTH! • Time to beat people up for their lousy performance, right?!! NCR Confidential
Blue Green Yellow Red Existing Balanced Scorecard color-coding for EO metric (+/-2% Variance from 95% target) Control Chart (Process Behavior) Executable Orders (1/99 - 5/00) • Process is STABLE • No trends or shifts • EO Results between 90.5% and 96.7% are EXPECTED! • Current process only capable of performing in this range • EVEN THOUGH THIS DOES NOT ACHIEVE THE TARGET!! • Reacting to values between 90.5% and 96.7% is a COMPLETE WASTE OF TIME!! • Variation within these limits is due solely to RANDOM CHANCE! • Process Improvement required to more consistently meet the target (Six Sigma Project needed) • Existing BSC color-coding is misleading • Has NOTHING to do with actual capability of the process! C o n tr o l C h a r t f o r % E x e c u t a b l e O r d e r s 9 7 U C L = 9 6 . 7 % s 9 6 r e Target d r 9 5 O e l 9 4 b a A v g = 9 3 . 6 % t u 9 3 c e x E 9 2 % 9 1 L C L = 9 0 . 5 % 9 0 M a y 0 0 J a n 9 9 M a y - 9 9 O c t - 9 9 M a r - 0 0 D a t e NCR Confidential
Frequency Plot (Histogram) Executable Orders (1/99 - 5/00) • QUESTION: Does knowing the average value (93.6%) provide a complete picture for how this process is performing??? • Frequency Plot shows # of occurrences at specific values over a period of time (1/99 - 5/00) • Knowing only the mean (average) blinds you to the actual range of values (from 91% to 95.5%) • Discover that data is approx. normally distributed Count (# Values) % Executable Orders (1/99 - 5/00) NCR Confidential
NCR Reporting Approach • Modify/Add Charts Contained in Monthly Review Templates to Illustrate Variation • “Bake” variation plots throughout monthly & quarterly reviews -- not just during brief Balanced Scorecard discussion • Use New ‘Exception Chart’ to Gain Insights from Variation • Contains metric details, type of variation, exception type, control chart, frequency plot (histogram), and ACTIONS (appropriate, based upon type of variation) • Better headlights to potential problems ahead • Reporting Approach • Review exceptions on Primary Scorecard during Monthly & Qtrly Reviews • Review exceptions on Secondary Scorecard only during Qtrly Reviews • Only Green or Red coloring to be used for summary view • Metric Exception if any one of the following is true: • Didn’t meet target during reporting period • Process is unstable / special cause(s) present • Process not capable of meeting target/spec. (target/spec. inside control limits) or or NCR Confidential
SAMPLEException Variation Chart (EVC)
Exception Criteria for Metric Reporting Metric Exception Criteria: • Didn’t meet target during reporting period • Process is unstable / special cause(s) present • Process not capable of meeting target/spec. (target/spec. inside control limits) Not an exception Exception - Fails Crit. 3 Exception - Fails Crit. 1 & 3 Exception - Fails Crit. 2 Exception - Fails Crit. 1,2, 3 Exception determination is made each reporting period for each point Exception - Fails Crit. 2, 3 NCR Confidential
Where to Collect Data:Process or Result? X’s Y’s Need to measure BOTH X’s (process measures) and Y’s (results measures) Customer sees the Y’s (results measures) NCR Confidential
Y Y Y X Moderate Positive Correlation X X Strong Positive Correlation No Correlation Y Y Y X X X Strong Negative Correlation Moderate Negative Correlation Other Pattern - No Linear Correlation Using Headlights to Predict Results • Goal is to Correlate Process Measures to Results Measures • Process measures from S-I-P of SIPOC • Inputs… also known as X’s • Results measures from O-C of SIPOC • Outputs… also known as Y’s • Verify, with data, that a specific set of inputs (X’s) affect key results metrics (Y’s) • Track process measures as leading indicators of results (better headlights) • Charts (on right) show scatter plots of X’s vs Y’s • Illustrate various levels of correlation Y = f(X) NCR Confidential
Scorecard and Metrics Team: Conductor - everyone on the same page using the same definition, source, calculation Compiler - taking data, action items, notes from all area/process mgrs and putting them all together for overall WCS view to RFG Consultant - providing training in data gathering, variance analysis, etc Process/Metrics Owner: Musician - playing the instrument/process in order to accomplish goals; and using EDW to track results Manager - providing action items, leading Six Sigma teams, researching exceptions Subject Matter expert - utilizing all available sources to record and analyze change Who Does What ?? NCR Confidential
NCR Scorecard Best Practices • Each metric has a process owner. • Process owner roles and responsibilities are clearly defined. • Target Setting done with process owner and their management based upon real data • Process owner responsible for the collection and analysis of data, with assistance from MBB’s. • All process owners are GB or BB trained. • Kickoff mtg held for all Process owners. • Monthly meetings with BU VP and BSC Process owner. • Metric/process owners report their own results -- not presented by an independent Quality organization. • Drive greater accountability for their results • Spin off Six Sigma projects to address BSC gaps. • Use of variation analysis not an option. NCR Confidential
Creating Order From Chaos:What You Can Do • Increase your personal knowledge of variation • Personally apply the tools to make variation visible • Don’t tamper or contribute to tampering • Partner with the business to get actual data and demonstrate - not just theory • Enable your managers and leadership to understand the value of variation • Act as a change agent to influence mangers and leadership to make the paradigm shift • Create a simple transition plan within your business - start now • Read this book! Understanding Variation the Key to Managing Chaos, by Donald Wheeler NCR Confidential