Download
1 / 78
870 likes | 1.42k Views
Balanced Scorecard. Alan Edwards Risk Manager, State of Utah aedwards@utah.gov. Objective of the DAS Balanced Scorecard Project. Increase efficiency and productivity within the Department of Administrative Services through the creation of a balanced scorecard

E N D
Balanced Scorecard Alan Edwards Risk Manager, State of Utah aedwards@utah.gov
Objective of the DAS Balanced Scorecard Project Increase efficiency and productivity within the Department of Administrative Services through the creation of a balanced scorecard • Identify or reassess “value drivers” that are key to achieving the mission of the department and division • Enable leadership to manage more effectively and respond to trends more quickly • Focus attention on the few activities that will most affect results • Improve performance of the DAS
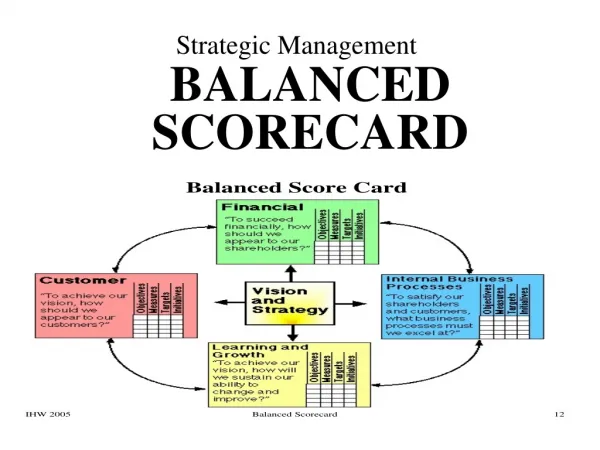
What is the balanced scorecard? • A balanced scorecard is a management tool that allows managers to lead through monitoring the performance of an organization on the few but vital set of activities and measures the drive enterprise success Why is balance essential? • A scorecard is ‘balanced’ when it focuses not just on financial dimensions but also other vital areas such as employees, customers, processes, and any other area crucial to the success of the organization
Guiding principles for effective scorecards Linked • KPIs must have strong and clear linkage with organization vision, strategy and goals • KPIs must be owned by those who will be accountable • Must be measurable with available data that is easily trackable • KPIs must be balanced to include financial and non-financial metrics as well as leading & lagging metrics • Performance should be assessed on the ‘vital few’, not the ‘trivial many’ KPIs • Targets must be set appropriately so that they are a stretch but achievable; they should be reviewed frequently • Must cascade up/down so that achievement of lower level KPIs ensures company reaches its corporate goals • Organization buy-in is critical and requires that metrics and targets are accepted by each organization Controllable Measurable Balanced Focused Appropriate targets Cascaded Buy In
After identifying candidate metrics linked to division strategy, filter down to ‘vital few’ Initial set of metrics (50+ potential metrics) • Metric owner influences/controls outcome measured • Input data available, objective and comparable over time •Duplication and “non-priority” metrics removed •Leading and lagging financial and non-financial metrics Controllable Measurable Focused Mix ‘Vital Few’ (target <15 metrics per scorecard)
Key learnings from past balanced scorecard projects • Focus on the few metrics that will have the highest practical impact • Learn by doing: continue to refine metrics and replace as needed • Engage people from multiple levels of the organization in developing metrics to ensure buy-in • Develop a plan early on for collecting relevant data • Don’t be afraid of red: the scorecard is your friend
Utah State Risk ManagementBalanced Scorecard Mission: Deliver risk management services needed by customers at a below-market cost of risk while exceeding customer expectations.
State of Minnesota– Operational Plans STRIMA Conference September 18-22, 2005 Presented by: Phil Blue, Director Risk Management - Minnesota
Purpose Discuss Operational Goals established by Risk Management Division of Minnesota Department of Administration
Topic of Discussion • Go over selected operational goals which have the dual objective of 1) keeping the Risk Management Division on track to achieve its objectives, and 2) keeping management apprised of goals and what was actually accomplished.
Operational Goals • Revenue & Expense • Staffing • Marketing Objectives • Expense Ratio vs. Industry • Subrogation Recovery vs. Industry • Claim Count • Non-Insured Tort Claims
Budget vs. Actual Budget by Fund –Revenue & Expense
Budget vs. Actual (cont’d) • If, in any measurement category, the variance is equal to or greater than plus or minus 5%, an explanation is required. • These results are also graphed.
Budget vs. Actual (cont’d) Marketing Calls Plus New Business
Budget vs. Actual (cont’d) Budget by Fund – Expense vs. Industry
Budget vs. Actual (cont’d) Budget by Fund – Subrogation vs. Industry-APHD
Budget vs. Actual (cont’d) Budget by Fund – Maintain average ratio of claims closed to new claims at 100%
Budget vs. Actual (cont’d) Non-Insured Tort Claims – Maintain average ratio of claims closed to new claims at 100%
Auto Liability Graph Average Claim Cost
Always strive for better and more meaningful operational measurements
Other Measurements Examples • Accidents per million miles driven • Percentage of claims in suit • Customer service - response time • New system implementation goals • Succession planning Good luck in establishing your goals.
Division of Risk ManagementFlorida Department of Financial Services
Overview of State of Florida Risk Management Program • The Division of Risk Management administers the state’s self-insurance program and training for the safety/loss control coordinators of each state agency in the program • 0 employees – all offices in Tallahassee • Receives approximately 18,000 -20,000 new claims each year all lines • Current annual program revenues of $169 million dollars administered through the State Risk Management Trust Fund • Funded on a “cash flow” basis so that only the estimated cash needs of the program are funded each year with no reserve funding to cover any portion of the total estimated ultimate liabilities of the program
Division of Risk Management Program Responsibilities • Provides six major types of “insurance” coverage to State of Florida agencies by administering a self–insurance pool • Processes claims filed against state agencies for these coverages • Collects premiums from participating state agencies to pay claims • Purchases private insurance as necessary to control risk exposure of state agencies • Provides assistance to state agencies in the areas of loss preventionloss control
Major Coverage Lines Provided • Workers’ compensation state employee injuries • Property state owned buildings and contents • General liability state agency premises and operations • Auto liability state employees on state business • Federal civil rights actions of state officials alleged to have violated someone’s civil rights • Employment discrimination actions of state employees violating employment discrimination laws
DEVELOPING PERFORMANCE MEASURES • DIVISIONMISSION: The mission of the State of Florida Risk Management Program is to ensure that participating State agencies are provided quality workers’ compensation, liability, federal civil rights, auto liability, and property insurance coverage at reasonable rates by providing self-insurance, purchase of insurance, claims handling, and technical assistance in managing risk.
BUREAU MISSIONS • Bureau of Property, Financial and Risk Services Mission: To provide property claims adjusting services to participating state agencies, to provide financial and cash management services to the Division of Risk Management, and to provide risk management training and consulting services to participating state agencies. • Bureau of State Employees’ Workers’ Compensation claims Mission: To provide quality claims service to injured state employees at a reasonable cost to state agencies. • Bureau of State Liability Claims Mission: To provide quality claims service to our customers.
DEVELOPING PERFORMANCE MEASURES • GOALS/OUTCOMES * Flow from the Mission and are more specific *Example: Process and pay 95% of all workers’ comp. medical bills and indemnity benefits timely • ACTIVITIES * Actions that lead or move toward the achievement of a goal. *Example: Processing benefits on workers’ compensation claims
DEVELOPING PERFORMANCE MEASURES • OUTPUTS * Specific products or services that are being delivered through actions. *Example: Number of benefit payments made timely in accordance with statutory requirements and Division of Workers’ Compensation Rules.
DEVELOPING PERFORMANCE MEASURES • OUTCOME/PERFORMANCE INDICATORS * Allows an organization to determine if it is successful in achieving its goals. *Example: At least 95% of Workers’ Compensation claim benefits are paid within statutory requirements and Division of Workers’ Compensation rules.
DEVELOPING PERFORMANCE MEASURES *Inputs: The resources needed/used to produce outputs * Efficiency: The cost effectiveness of the inputs in relation to the outputs
DIVISION OF RISK MANAGEMENT PERFORMANCE MEASURES The Bureau of Property, Financial & Risk Services MISSION: The mission of the Bureau of Property, Financial & Risk Services is to provide property claims adjusting services to participating state agencies, to provide financial and cash management services to the Division of Risk Management, and to provide risk management training and consulting services to participating state agencies. INFORMATION SOURCE GOAL ACTIVITY OUTPUT OUTCOME I. Property Section: Purchase Amount of excess Purchase most beneficial excess property property insurance Broker of Record/Excess excess property insurance. insurance. coverage obtained. Rate on Line. property insurance policy. II. Financial Section: Number of checks issued within Prompt payment Process all payments prompt payment compliance IAW FS 215.422 Issue checks. timeframe. rate. CAS/Excel III. Risk Services Section: Analyze agency claim data Loss trend analysis Number of Percent reduction and provide loss trend and hazardous hazardous condition in claims reported analysis to agency safety condition notifications at targeted coordinators notifications. made. locations. CAS/Excel Spreadsheet.
The Bureau of State Employees' Workers' Compensation Claims MISSION: Provide quality claims service to injured state employees at a reasonable cost to state agencies. Goals Activity Output's Outcome Information Source To provide quality claim services to our customers. Handling WC claims 1. Number of WC claims worked 2. Customer Satisfaction Survey results The average score of the Customer Satisfaction Survey indicates that our overall claims adjustment service is "good" or "excellent". Customer Satisfaction Survey CAS Process and pay 95% of all medical bills and indemnity benefits timely. Processing benefits on WC claims Benefit payments made timely in accordance with statutory requirements and Division of WC Rules At least 95% of WC claim benefits are paid within statutory requirements and Division of WC Rules Maintain the WC Benefit Cost Rate within 10% of the average of previous three fiscal years. Handling WC claims Workers' Compensation Benefit Cost Rate Maintain a constant claim cost rate as a percentage of state payroll, thereby stabilizing program cost to state agencies. CAS and data from previous years
Goals Activity Output Outcome To adjust (investigate, Claims handling. Number of claims closed during The number of claims closed during a evaluate, settle, deny and fiscal year as compared to the fiscal year will equal or exceed the defend) claims efficiently number of new claims received. number of new claims received . and economically. Total claim expenditure for fiscal year. To provide quality claims Claims handling. Number of Customer Satisfaction At least 90% of respondents to the adjustment services to our Customer Satisfaction Surveys sent to state of Florida Customer Satisfaction Survey indicate customers, state of Florida Survey. agencies. that our overall claims adjustment agencies. service is “good” or “excellent”. The Bureau of State Liability Claim MISSION: Provide quality claims service to our customers. The total liability claim expenditure for each fiscal year is reduced, or any increase will not exceed the increase in the Consumer Price index, resulting in a reduction of cost to state of Florida agencies.
Risk Management Program Performance Measures Michael M. Kaddatz, CPCU, ARM ARM Tech/Aon Risk Consultants Irvine, California michael_kaddatz@armtech.com
…Executive management needs perspective Is it just us experiencing significant change? Executive
…Risk managers need perspective Are underwriters singling us out? What have others done to find solutions to market pressures? Risk Manager
…The search for best practices Why not use data rather than hearsay to find out who may be doing better?
..Helps set priorities Given limited time and resources, where is the low hanging fruit in achieving better cost efficiency?
…Supports needed change If our state’s rate of loss exceeds the norm, we need to initiate action
Two Surveys Completed The learning has begun!
Actuarial Study CAFR Data for COST of RISKis readily available Budget Insurance Schedules
Cost of Risk … Definitions can be set to approach anapples-to-apples comparison