Download
1 / 11
230 likes | 983 Views
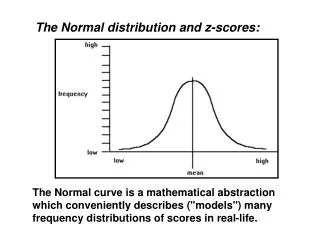
The 68-95-99.7% Rule and z-scores. Normal distribution. The shape of histograms sometimes approximate what is known as a “bell-shape.”. Normal distribution. By joining the columns of the histogram together, a bell-shaped curve is formed.

E N D
Normal distribution • The shape of histograms sometimes approximate what is known as a “bell-shape.”
Normal distribution • By joining the columns of the histogram together, a bell-shaped curve is formed. • When we get data that forms a bell-shape, we call it a normal distribution. • Two important things to remember about normal distributions: • The mean of the data, , is at the centre of the bell-curve. • Most of the data is gathered close to the mean. The further we go from the mean the less data there is.
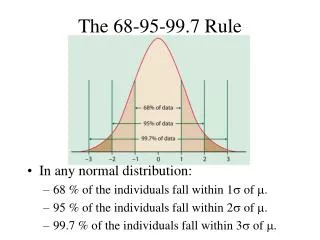
The 68-95-99.7% rule • Recall that standard deviation, s, is a measure of the spread of the data. • In a normal distribution, 68% of data have values within 1 standard deviation of the mean.
The 68-95-99.7% rule 95% of the data have values within 2 standard deviations of the mean.
The 68-95-99.7% rule 99.7% of the data have values within 3 standard deviations of the mean.
The 68-95-99.7% rule • Using the 68-95-99.7% rule, we can work out the percentage of data in each section of the bell curve.
Questions • Examples on board 1I, Q. 2, 3, 4, 10, 13 • Questions: 5, 7, 9, 11, 14
z-scores • The z-score indicates the position of a certain score in a set of data relative to the mean. • It enables us to compare scores in different distributions. • A z-score of zero means that the score is equal to the mean. A negative z-score means that the score is below the mean, and a positive z-score is a score above the mean.
z-scores • Calculate z-scores using the formula where x is the score, is the mean, and s is the standard deviation. • A z-score of -1 would mean that the score is one standard deviation below the mean. A score that is one standard deviation above the mean would have a z-score of +1.
Questions • Examples: 15, 20, 23 • Questions: 16, 19, 22, 25