Download

1 / 11
110 likes | 195 Views
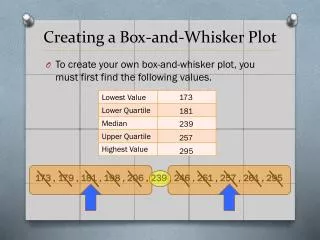
Box Plot Project. Instructions for Analysis. US Precipitation (Jan vs. July).

E N D
Box Plot Project Instructions for Analysis
US Precipitation (Jan vs. July) • The following is a stem and leaf of the data. Each is the average precipitation in inches for US cities. The data was taken from the 2003 World Almanac. It was sampled systemically (every third city according to lat./long.)
Stem and Leaf Analysis • This plot shows that level of precipitation is greater in July than it is in January
Stem and Leaf Analysis • The data for July is skewed towards the lower totals so more data values lie in the 30’s, 40’s and fewer values fall in the single digits, 10s and 20’s
Stem and Leaf Analysis • The data for July is skewed towards the lower totals so more data values lie in the 30’s, 40’s and fewer values fall in the single digits, 10s and 20’s • The data for January is bimodal with the highest categories in the 10’s and 30’s
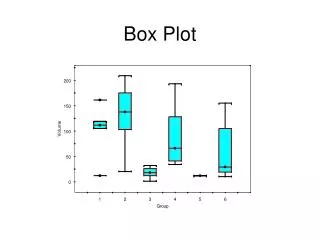
Box and Whisker January July 0 1 2 3 4 5 6 7
Box Plot Analysis • Same IQR so the middle 50% of data varies about the same amount • The center (median) is higher for the July data, and the maximum is also higher. • The minimum of both sets is close to zero
Box Plot Analysis • Same IQR so the middle 50% of data varies about the same amount • The center (median) is higher for the July data, and the maximum is also higher. • The minimum of both sets is close to zero • The July data is skewed left with most of the data on the right side where the rain totals are higher
Box Plot Analysis • Same IQR so they have the vary about the same amount • The center (median) is higher for the July data, and the maximum is also higher. • The minimum of both sets is close to zero • The July data is skewed left with most of the data on the right side where the rain totals are higher • The January data is irregular since it has the median closer to the right side and the whisker is also longer on that side
Box Plot Analysis • Overall it can be concluded from the box and whisker comparison that there was more rain in July than in January • **Analysis of both plots are due Friday**
Test Corrections • Follow 4 step format for math test corrections • For T or F and Multiple choice errors only steps 1 and 4 are necessary • Any work that is done in your calculator must be explained in writing