Download
1 / 15
150 likes | 227 Views
Investigating cholesterol metabolism using functional linear models applied to mouse liver data. Explore flow curves, phase-plane plots, and covariate interactions to understand metabolic processes.

E N D
What questions can we ask of the data? • What does the real, “smooth” process look like? • Do shapes differ among groups? • Do rates of change differ among groups?
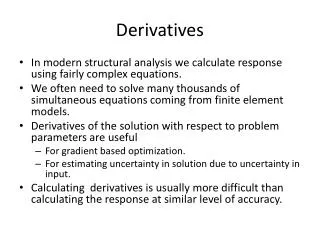
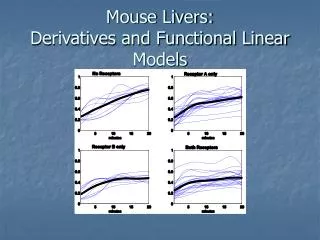
What do the flow curves look like as functional objects? • Took the derivative of the smoothed curves. • Still retain curve-to-curve variability, but now much smoother.
How can I graphically explore the data? Phase-Plane Plots • Have: • flow curves x(t). • rate of change of flow curves Dx(t). • Plot Dx(t) vs x(t). No longer an explicit function of time! • Overlay time points on the curve for interpretation. • Gives information about how function is linked with its derivative.
What do we see in these phase-plane plots? • Difference in curves between receptors and no receptors • Cusps or ‘change-points’ when there are receptors • Minute 9 for Receptor A; Minute 15 for Receptor B • Minute 9 for Both Receptors: Interactive Effect?
What is the relationship between the covariates and response curves? • Functional response; Scalar predictors. • Regression coefficients are functional. • Use basis expansion methods. Functional Linear Models X(t) = β0(t) + β1(t)A + β2(t)B + β3(t)A*B + ε(t),
Receptors affect steady state. • B stronger than A. • Effects strongest after minute 9. • A and B have inhibitory relationship after minute 9.
Receptors affect steady state. • B stronger than A. • Effects strongest after minute 9. • A and B have inhibitory relationship after minute 9.
Can also do a functional linear model for derivative (rate of change): FDA allows us to work with derivatives – which are closer to the mechanisms of the process dX/dt = β0(t) + β1(t)A + β2(t)B + β3(t)A*B + ε(t),
A “kicks in” earlier than does B. • A kicks in at minute 9, B at minute 15. • When together, see push only at minute 9 (from A?)
What have we learned? • Creating a functional object • Smoothing with basis expansions to reduce noise • Examining derivatives graphically • Phase-plane plots • Building functional linear models • Functional regression coefficients • Derivatives helpful here, too