Download
1 / 22
220 likes | 239 Views
This overview provides information on state aid to school districts in New York, including revenue sources, expenditure breakdown, and aid formulas. It also covers the School Tax Relief program (STAR) and its impact on school funding.

E N D
State Aid to School Districtsin New York State:An Overview Based on the Laws of 2007 Attachment B State Aid Work Group New York State Education Department April 25, 2007
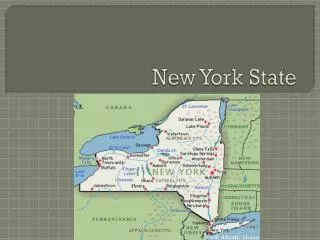
School District Types • 652 K-12 school districts and 25 non-K-12 districts employ 8 or more teachers and are eligible for regular State Aid. • All are fiscally independent (with independent taxing and borrowing authority) except the Big Five. • 37 Boards of Cooperative Educational Services (BOCES) provide a range of programs and services to groups of school districts other than the Big Five. • Six districts with fewer than eight teachers are eligible to receive only Operating and Transportation Aids.
Total Revenue from State Sources Total General and Special Aid Fund Expenditures Average Total Expenditure Per Pupil* Average State Revenue Per Pupil* $21.40 billion including STAR $48.3 billion $17,104 $7,578 New York State PK-12 EducationA $48.3 Billion Enterprise (2006-07 Estimated) *DCAADM
Sources of Revenue for EducationNew York State, Major School Districts, 2004-05
Where the Education Dollar is GoingNew York State, Major School Districts, 2004-05
Local Revenues (2004-05) • Constitute 50 percent of education revenues • About 90 percent derives from property taxes levied by boards of education on residential and commercial properties • Only the Big 5 Cities have constitutional tax limits; limits apply to total municipal budget, of which the school budget is a part • The considerable reliance on local revenues results in large spending disparities among school districts
State Revenues for Education • 88 percent of State revenues for education from State General Fund, primarily from income and sales taxes • State sales tax laws reserve 4 percent for the State and permit counties and cities to levy up to an additional 4 percent • Approximately 12 percent comes from a special revenue fund account supported by lottery receipts
Revenue from State Sources* as a Percent of Total Expenditures for Public Schools • Low: 1944-45 31.5 percent • High: 2001-02 48.2 percent • Current: 2006-07** 44.3 percent *2006-07 includes State revenues for School Tax Relief (STAR): 7.0 percent. ** Estimated.
How Major State Aid Formulas Work There are primarily three types of formulas: 1. Foundation Formulas: Adjusted Expense – Local Contribution Used in: Foundation Aid 2. Per Pupil Formulas: Pupil Count x Dollar Amount x District Aid Ratio Used in: Hardware Aid 3. Expense-based Formulas: Approved Expenses x District Aid Ratio Used in: Transportation, Building, BOCES, Special Education Note: The District Aid Ratio varies with district need. It represents the share the State pays; the balance is provided primarily from local sources.
Traditional Factors that Drive Aid • District Fiscal Capacity • Income per pupil and Actual Value of taxable property per pupil (Foundation, Special Education) • Actual Value per pupil (Transportation [one of two options], Building, BOCES) • Pupil Need Factors • Foundation Aid uses an Extraordinary Needs Count, a mixture of student poverty, students with limited English, and geographic sparsity • Spending • Textbook, Library, Software, Hardware (up to a per-pupil cap) • Transportation, Building and BOCES • Special Education (public high cost and private) • Pupil Counts • Used extensively in Foundation, Universal Pre-Kindergarten and Special Education • Used in minor ways in Transportation and Building Aids
Foundation Aid: 2007-08 and Beyond • Change to a Needs-based, Cost-adjusted Formula • District’s State Aid per Pupil = [Foundation Cost X Pupil Need Index X Regional Cost Index] – Expected Local Contribution.
What are the Components? • The Foundation Cost is the cost of providing general education services, measured by determining instructional costs of districts that are performing well. • The Pupil Needs Index recognizes the added costs of providing extra time and extra help for students to succeed.
Foundation Aid, con’t. • The Regional Cost Index recognizes regional variations in purchasing power around the State, based on wages of non-school professionals. • The Expected Local Contribution is an amount districts are expected to spend as their fair share of the total cost of general education.
The Increase in 2007-08 Foundation Aid by Need Resource Category Note: Includes Supplemental Educational Improvement Plan Aid.
Foundation Aid per Pupil in 2007-08 and 2010-11 by Need Resource Category
Highest Need School Districts Tax at a Higher Rate, but Tend to Raise Less and Spend Less
STAR • School Tax Relief Program--enacted in 1997 and took effect with the 1998-99 school year • The State makes payments to school districts to compensate them for reduced property tax receipts • Began with implementing a State funded school property tax exemption for senior citizen homeowners • Planned for a 4-year phase-in, subsequent legislation provided for full implementation for seniors in the first year (1998-99) • Middle Class STAR Program--enacted in 2007--targets tax relief to middle income homeowners
STAR (continued) • Exemption for owner-occupied primary residences. • Enhanced exemption: $50,000 for an owner (or one of a couple) over 65; annual income cannot exceed $67,850 • Basic exemption: $30,000 for all primary residence homeowners (begun in 1999-00, phased in over 3 years)
School Tax Relief (2006-07) by School District Need Categories
State Aid Issues School Year 2008-09 • Continue to phase in a foundation formula based on the cost of success • Continue to phase in support for early Childhood Education • Strengthen accountability through contracts for excellence • Provide for sustainability in funding and cost-effectiveness in operation