Download
1 / 15
150 likes | 297 Views
DEMOGRAPHICS REPORT 2008-2009 School Year. Presented January 15, 2009. Highlighted Demographics. District Teacher Experience English Language Learner Population Free & Reduced Meals Population Student Ethnicity Data Special Education Student Population.

E N D
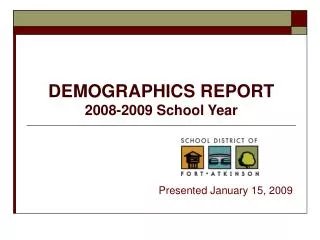
DEMOGRAPHICS REPORT2008-2009 School Year Presented January 15, 2009
Highlighted Demographics • District Teacher Experience • English Language Learner Population • Free & Reduced Meals Population • Student Ethnicity Data • Special Education Student Population NOTE: Numbers for this report were pulled from our student information system in December of 2008
Classroom Teacher ExperienceDISTRICT-WIDE Experience includes credited years at hire plus completed years in our district
Classroom Teacher Experience ChartDISTRICT-WIDE 160 Total Classroom Teachers
District-wide ELL / Free & Reduced Population English Language Learner Population Free or Reduced Meals Population
Special Education 14% of total population is identified as Special Education Breakdown of Special Education Population
Special Education*Other includes autistic, hearing impaired, health impaired, orthopedic impaired, significant development delay and vision impaired.
Conclusions • We have a nice balance of new and experienced teachers in our district. • Our ELL and Free & Reduced Meal populations continue to grow. • Our student population continues to become more ethnically diverse. • Our identified Special Education population has been stable and remains slightly above state average.