NEW: Logging into ASUAD domain
300 likes | 484 Views
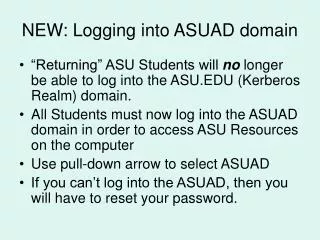
NEW: Logging into ASUAD domain. “Returning” ASU Students will no longer be able to log into the ASU.EDU (Kerberos Realm) domain. All Students must now log into the ASUAD domain in order to access ASU Resources on the computer Use pull-down arrow to select ASUAD

NEW: Logging into ASUAD domain
E N D
Presentation Transcript
NEW: Logging into ASUAD domain • “Returning” ASU Students will no longer be able to log into the ASU.EDU (Kerberos Realm) domain. • All Students must now log into the ASUAD domain in order to access ASU Resources on the computer • Use pull-down arrow to select ASUAD • If you can’t log into the ASUAD, then you will have to reset your password.
SPSS WORKSHOP Please Log onto Your Computer Station User Name: type in your user ID Password: type in your password Domain: ASUAD If you have trouble signing in: Then try signing in with westguest account User Name: westguest Password: asuwest Domain: (this computer) Sometime after today’s class, please go to technopolis (basement of library) to get your user ID fixed.
Brief Introduction to Statistics with SPSS Roger Berger Mathematical Sciences & Applied Computing Program Rico Rivera Josh Fox Statistics Laboratory http://www.west.asu.edu/StatLab
Workshop Overview • Workshop Objectives (p 1) • Understand Basic Organization of SPSS • How to input, save & retrieve raw data • How raw data file is edited in variable view • Perform basic data analyses • Table of Contents (p 2)
Open up your internet Explorer http://www.west.asu.edu/StatLab • Click on the Stat Lab button (located on left side) • Click on Workshops • Click on Data used for Workshops • Click on Res_Stat_Edited.sav • Please save it in your Desktop. • Close the internet brower.
SPSS Accessibility (p. 3) • Network access • Technopolis (basement of library) • Desktop (hard drive) installed • Computer Classrooms • Stat Lab
Accessing the Statistic Laboratory(p. 3) • Location: CLCC 107 • Phone: (602) 543-6117 • Website: http://www.west.asu.edu/StatLab • Operating hours: See website (changes on a weekly basis) • When using the lab, students sign in at the front counter
Support for Statistics (p. 4) • Function of Stat Lab (also pp. 14-16) • The Stat Lab staff assists students with aspects of statistical software. • The Stat Lab is not set up to provide one-on-one tutorial service for students on a regular basis. • However, we have and frequently do answer general statistic questions. • Statistics Tutoring • Learning Enhancement Center • TRiO (SSS) program
Procedures for Data Analysis (p. 6) Data StatPak Output Interpretation • Collect & organize data • Input & edit the data • Transform Variables [will not be covered] • Analyze data or create graphs • State results and interpret
Please fill out the Research & Statistical Attitude Survey(Remove the last page of your handout) • Response • Strongly Disagree • Disagree • Agree • Strongly Agree • Sex • Male • Female • Age • Under 25 • 25 – 40 • Over 40 • Response • Strongly Disagree = 1 • Disagree = 2 • Agree = 3 • Strongly Agree = 4 • Sex • Male = 1 • Female = 2 • Age • Under 25 = 1 • 25 – 40 = 2 • Over 40 = 3 • Having ID column will help you keep track of cases • What do the first 5 questions (items) measure? • What do items 6 through 10 measure?
Let’s Launch SPSS • Menu Bar • Data & Transform are used to manipulate the data in data editor (i.e., spread sheet) • Analyze and Graphs are used to create output • Tabs (bottom left hand corner of data editor, p. 7) • Data View • Columns: Variables (e.g., questions on survey) • Rows: Cases (e.g., survey) • Variable View • How we edit the variables • Give variables their names, labels, etc • Enter you survey into Data View
Editing the Raw Data • Variable View • Tab (located lower left hand corner) • Pages 10 – 11 of your handout
Contingency Table Examplep 153 of your text book • Littering behavior (Geller, Witmer, & Orebaugh, 1976) • Does a message about not littering written on supermarket hand bills reduce littering behavior? • Two Conditions • Control: contained only a listing of daily specials • Message: also contain message “Please don’t litter. Please dispose of this properly.” • Recorded the number of handbills that were found • Trashcans • Shopping carts, floor, & various places • Could not be found and apparently removed from premises
Frequency Distribution of Instructions by Location(N = 1772) • Given the table we are going to re-created it and also calculate the chi-square statistic in SPSS.
In Variable View • 1st, give the variables names • 2nd, give the variable labels
Value Labels • Set the value labels for row variable • Set the value labels for column variable
Enter values for row • Recall that for row: Control=1 Message=2
Enter values for column • Recall that for Column: Trash Can=1 Litter=2 Removed=3
Enter the frequency • Enter the frequency counts
Enter the frequency • Enter the frequency counts
Creating a contingency table and computing a chi-square (χ2)
Creating a contingency table and calculating a χ2 • Click on button called Statistics
After clicking on button called statistics, you get a dialogue box called Crosstabs: Statistics • Choose Chi-square • In Nominal submenu select Phi & Cramér’s V
Thanks for having us Do keep the “Research and Statistics Attitude Survey” you filled out. Please close SPSS & log off your computer. Please turn in the “SPSS Workshop Evaluation” as you leave the room. Have a good day.