Download
1 / 1
10 likes | 175 Views
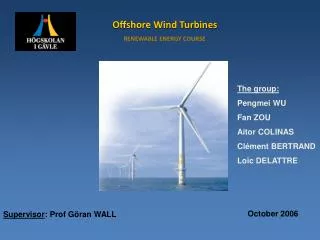
Effects of Scale on Model Offshore Wind Turbines An Examination of How Well Scaled Model Wind Turbines Can Represent Full Sized Counterparts. Group Members: Zachary Charewicz Dimitry Harris Zachary Countie.

E N D
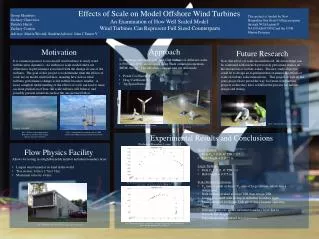
Effects of Scale on Model Offshore Wind Turbines An Examination of How Well Scaled Model Wind Turbines Can Represent Full Sized Counterparts Group Members: Zachary Charewicz Dimitry Harris Zachary Countie This project is funded by New Hampshire Sea Grant College program through NOAA grant # NA10OAR4170082 and the UNH Marine Program Advisor: Martin Wosnik Student Advisor: John J Turner V Motivation Future Research Approach It is common practice to use model wind turbines to study wind turbine array dynamics. As with most scale models there are differences in performance associated with the change in size of the turbines. The goal of this project is to determine what the effects of scale are on model wind turbines, meaning how does a wind turbines performance change as the turbine becomes smaller. A more complete understanding of the effects of scale can lead to more accurate prediction of how full scale turbines will behave, and possibly prevent situations such as the one pictured below. Now that effects of scale are understood, this knowledge can be combined with research previously performed studies on the interaction of turbine wakes. The new study objective could be to design an experiment that examines the effects of scale on turbine wake interactions. This project as well as last years project have paved the way for future wind turbine projects in that they have solidified the process for turbine design and testing. • To determine effects of scale, two wind turbines of different scales (1/500 and 1/250) are designed using blade element momentum (BEM) theory. The following comparisons are then made. • Power Coefficient (CP) • Drag Coefficient (Cd) • Tip Speed Ratio (λ) Fig 8: Adjusting rotor resistance while testing Fig 5: Turbines side by side rotating comparison in test section Fig 4: Rear view of turbines in test section Fig 1: Turbine wake propagation at Horns Rev in Norway. Only leading turbines experience full flow. Fig 2: German RePower turbine rated at 5 MW, similar to the NREL reference turbine used to scale. Experimental Results and Conclusions (Turbulent Boundary Layer) m • Small Turbine • Peak Cp ≈ 0.18 @ TSR ≈ 2.5 • Hub Height = 0.1875 m • Large Turbine • Peak Cp ≈ 0.21 @ TSR ≈ 4 • Hub Height = 0.375 m • Scale Model Conclusions • Cpmax of small turbine ≈ Cp max of large turbine, which was a design goal. • Both turbines peaked at lower TSR than design TSR. • Losses associated with testing in turbulent boundary layer. • Model designed for higher TSR allows for a broader operating range • Different positions within turbulent boundary layer due to different hub heights • Experimentation validated design process Flow Physics Facility • Allows for testing in a high Reynolds number turbulent boundary layer • Largest wind tunnel of its kind in the world • Test section: 6.0m x 2.7m x 72m • Maximum velocity 14 m/s Fig 6: Experimental power coefficient vs tip speed ratio for 0.125m turbine rotor radius. Designed for peak Cpat TSR = 3. m Fig 7: Experimental power coefficient vs tip speed ratio for 0.25m turbine rotor radius. Designed for peak Cp at TSR = 5. Fig 3: UNH Flow Physics Facility boundary layer wind tunnel