Download
1 / 1
30 likes | 151 Views
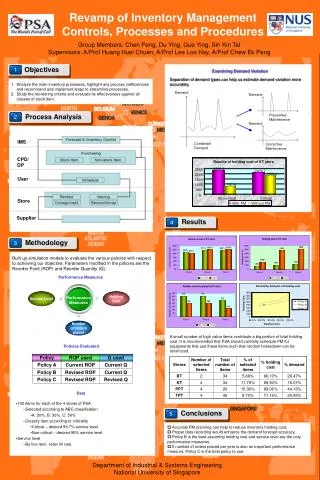
Demand. Demand. Performance Measures. Preventive Maintenance. Objectives. 1. Demand. Combined Demand. Corrective Maintenance. Process Analysis. 2. Results of holding cost of KT store. IMS. 2280.2. 2500. 2079.7. 1808.4. 2000. 1500. CPD/ DP. 787.5. 1000. 500. 0. Non-critical.

E N D
Demand Demand Performance Measures Preventive Maintenance Objectives 1 Demand Combined Demand Corrective Maintenance Process Analysis 2 Results of holding cost of KT store IMS 2280.2 2500 2079.7 1808.4 2000 1500 CPD/ DP 787.5 1000 500 0 Non-critical Critical User With PM Without PM Store Supplier 3 Service Level Holding Cost Number of Orders placed Revamp of Inventory Management Controls, Processes and Procedures Examining Demand Variation Separation of demand types can help us estimate demand variation more accurately. • Analyze the main inventory processes, highlight any process inefficiencies and recommend and implement steps to streamline processes. • Study the reordering criteria and evaluate its effectiveness against all classes of stock item. Results 4 Methodology Group Members: Chen Peng, Du Ying, Guo Ying, Sin Kin TatSupervisors: A/Prof Huang Huei Chuen, A/Prof Lee Loo Hay, A/Prof Chew Ek Peng Built up simulation models to evaluate the various policies with respect to achieving our objective. Parameters modified in the policies are the Reorder Point (ROP) and Reorder Quantity (Q). Performance Measures Sensitivity Analysis of holding cost 1600 1400 1200 Policy A 1000 Holding Cost 800 Policy B 600 Policy C 400 200 0 80.0% 85.0% 90.0% 95.0% 100.0% Service Level A small number of high value items contribute a big portion of total holding cost. It is recommended that PSA should carefully schedule PM for equipments that use these items such that random breakdown can be minimized. Policies Evaluated Data • 100 items for each of the 4 stores of PSA • Selected according to ABC classification • A: 20%, B: 30%, C: 50% • Classify item according to criticality • Critical – desired 99.7% service level • Non-critical – desired 95% service level • Service level • By line item: order fill rate Conclusions 5 • Accurate PM planning can help to reduce inventory holding cost. • Proper data recording would enhance the demand forecast accuracy. • Policy B is the best assuming holding cost and service level are the only performance measures. • If number of orders placed per year is also an important performance measure, Policy C is the best policy to use. Department of Industrial & Systems Engineering National University of Singapore