Download

1 / 35
350 likes | 370 Views
This presentation discusses source apportionment methods for analyzing air quality data, including organic speciation, transportation analysis, and episode analysis. It covers the Midwest RPO study presented at a national meeting in 2005.

E N D
Elements of a Weight of Evidence Determination Donna Kenski Midwest RPO presented at National RPO Meeting, Denver, June 2005
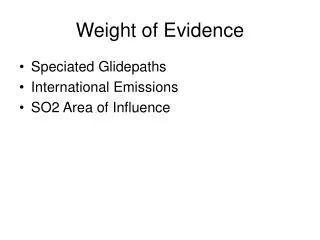
Components • Start with integrated conceptual model—O3, PM, RH • Source apportionment of STN and IMPROVE • Organic speciation and source apportionment – urban and rural • Ammonia/nitric acid – which precursors control PM? • PM trends • Episode analysis • Transport and trajectory analysis • Ozone • weekend/weekday differences, • trends, • NOx/VOC limitation
Source apportionment of IMPROVE and STN data • Work by Eugene Kim and Phil Hopke: PMF, ME, CPF, PSCF
Bondville, IL Source profiles • Bondville IMPROVE site • Mar. 2001 – May 2003 • 9 sources
Bondville, IL Averaged source contributions
4/22/2001 7/1/2002 Bondville, IL Time-series source contributions Backward trajectories
Bondville, IL CPF plots Weekday/weekend variations
Gasoline vehicle emissions Diesel emissions 8 carbon fraction profiles • Gasoline emissions include the lower temperature carbon fractions (OC1 - OC4). • Diesel emissions contain large amounts of the EC1
Secondary sulfate aerosol: Bondville • Summer-high:Tennessee, Ohio river valley, Ohio, Louisiana, Alabama • Carbon-high:Canadian forest fire, Nebraska, Dakota, Minnesota, Iowa • Winter-high:Nebraska, Kansas, Oklahoma, Texas, Tennessee valley, Ohio river valley
Inter-site comparison • Secondary sulfate • The largest contribution to the PM2.5 • Secondary nitrate, Motor vehicle • The 2nd largest contribution to the PM2.5 General summary of the source contributions
Gasoline vehicle emissions • No strong weekday/weekend variation • Rural sites show lower conc.
LADCO Organic Speciation Projects • 1. Seney National Wildlife Refuge • Analysis of existing speciation carbon channel filters (monthly composites) for 2002 • Collection and analysis of 28 high volume filters for summer 2002 • 2. Urban organics • Collection and analysis of 1/6 day, high volume samples at Indianapolis, Detroit, Cincinnati, Chicago, St. Louis, and Bondville, 2004 calendar year
Urban organic speciation sites Detroit, MI Northbrook, IL Cincinnati, OH Bondville, IL Indianapolis, IN St. Louis, MO
Data Overview • At six sites (five urban, one rural) during Dec 2003 – Feb 2005, collocated with STN measurements, quartz fiber filters (QFFs) sampled • QFFs analyzed for OC/EC • Monthly composites of QFFs for speciation done at all sites • Indianapolis selected for organic speciation of all 60+ samples during period • At Indianapolis and Bondville, 3-hr DRUM data taken during sampling days
Seasonal Composition - Indianapolis Median OMC>SO4 NO3>OMC>SO4 OC graphed as OMC=1.4*OC
Weekday-weekend: OC OC has no significant trend Northbrook – Feb 04 – Jan 05 Cincinnati – Feb 04 – Jan 05
Weekday-weekend: EC EC shows clear weekday-weekend trend Detroit – Feb 04 – Jan 05 Cincinnati – Feb 04 – Jan 05
Urban OC Summary • A large, generally high-quality data set is being assembled • PM2.5 concentrations were sufficiently high and variable during the sampling campaign to be of interest to policy makers • While STN, IMPROVE and other data routinely collected are useful, additional OCEC and speciated organics data will greatly help source apportionment efforts
Midwest Ammonia Monitoring • Despite importance of ammonia in atmospheric chemistry, no national studies or routine monitoring of ambient (non-source-influenced) concentrations has been done • To fill data gap, MRPO and CENRAP began rural monitoring in Oct. 2003 • Beginning network--10 sites: 9 rural, 1 urban • Current network – 12 sites, 8 rural, 3 urban • All rural sites are IMPROVE sites except Pleasant Green, MO • Denuder/filterpack sampling • Phosphoric acid coated denuder for NH3 • Sodium carbonate coated denuder for HNO3 and SO2 • Teflon filter followed by nylon filter (for nitrate dissociation) • Two sites (Pleasant Green MO, Lake Sugema IA) use automated R&P samplers (different denuder/inlet configurations) • 1/6 day sampling • Two continuous samplers, Pranalytica and IC, at Bondville for QA • Both NH3 and HNO3 very difficult to measure, due to reactivity, ‘stickiness’, low ambient concentrations, significant inlet losses
LADCO-CENRAP NH3 Network Red=urban sites Blue=rural sites
Temporal variation in NH3 Log scale Base F2 NH3 Emissions
Predicted PM2.5 Concentrations (Blanchard & Tanenbaum) PM is about equally sensitive to reductions in SO4 and NO3 PM is slightly more sensitive to NH3 reductions than to HNO3
Nitric acid limited Nitric acid limited Sample-by-sample evaluation of gas ratio and excess ammonia (Blanchard & Tanenbaum) Nitric acid limited Nitric acid limited
PreliminaryConclusions • At current conditions, PM mass decreases in response to reductions in sulfate, nitric acid, and ammonia • At current conditions, particulate nitrate formation limited generally by nitric acid • At expected future conditions (i.e., lower sulfate), PM mass is more responsive to nitric acid reductions • Daily and hourly data support same conclusions
Future Applications for NH3 Data • Model evaluation (Kirk Baker dissertation) • Inventory validation – daily variability, seasonal variability, diurnal variability • Correlations with meteorology, other AQ parameters • PM episode analysis – Feb. ’05 event, role of snow as source/sink
Episode AnalysisBased on AIRNOW From Rudy Husar • Time pattern of the 0502 Event • The overall event lasted about 10 days, Jan 28-February 7 • The Upper Midwest peaked first (Jan 31-Feb 2); Industrial MW later (Feb 3 – 6) • The Industrial MW region show more diurnal variation (lowest in the mid-afternoon) 0502 PM Event PM Event
24 hr Average PM-2.5 Concentrations in Michigan (1/26/05 thru 2/10/05) warm air advection cold front approaches From Neal Conatser, Mich. DEQ strong cold front passes weak cold front passes