Download
1 / 14
140 likes | 247 Views
Join us for a hands-on workshop designed for first-year computing students, focusing on using R for scientific calculations, data visualization, and analysis. This workshop includes two sessions in our computer terminal rooms and covers essential R concepts such as plotting graphs, defining functions, and handling data files. Participants will learn to perform linear fittings, numerical integration, and more. Get started with R, an open-source statistical computing environment, and discover its capabilities. Download R beforehand and prepare for an engaging learning experience!

E N D
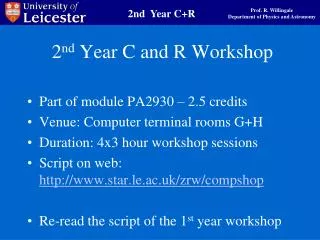
First Year R Computing Workshop • Part of module PA1900 – 1st year laboratory • Venue: Computer terminal rooms G+H • Duration: 2x3 hour workshop sessions • Script on web: http://www.star.le.ac.uk/zrw/compshop
Purpose of the Workshop • Learning how to use R to do the following • Simple scientific calculations • Plotting graphs • Defining and using functions • Using R scripts as computer programs • Creating, reading and writing ASCII data files • Linear fitting to data sets • Plotting measured data points including error bars • Performing simple numerical differentiation and integration • Plotting and analysing functions of 2 variables or 2-d images • Using R for analysis and plotting in labs
What is R? • R is an open-source environment for • statistical computing • visualisation (plotting graphs, pictures…) • R is an excellent general programming environment beyond statistics • R is free and freely available • http://www.r-project.org/ • Download R onto your own laptop
Getting started with R • Logon to a UoL IT Windows machine. • StartAllProgramsR for WindowsR 3.0.0 (64-bit) click • Use Windows Explorer to create a new folder (directory) where you will save all your R files. • My Documents/Rwork • Use the Rwork folder as the working directory for R. In the R GUI use the File menu top left • FileChange dir click • Type commands at prompt > in the R console.
The R Working Directory and Quitting > setwd(“Rwork”) set the working directory > getwd() [1] “Z:/My Documents/Rwork” get the working directory (and list) > list.files() list the files in the working directory > q() quit R – don’t save workspace
Getting Help Help menu at the top of GUI screen HelpHtml help click for general browsing HelpR functions (text) click for help on known function/command
The R Console Navigate through previous lines using simple control key stokes ctrl-p go to previous line ctrl-n go to next line ctrl-a go to start of current line ctrl-e go to end of current line ctrl-b go back 1 character ctrl-f go forward 1 character Cut and past ctrl-c cut text highlighted using cursor to clipboard ctrl-v paste text from clipboard to current position Complete word facility – TAB (left-hand little finger) HelpConsole
Variables, Objects and Assignment > x <- 3*pi > x [1] 9.424778 > x <- 1:5 > x [1] 1 2 3 4 5 > y <- sin(x) > y [1] 0.8414710 0.9092974 0.1411200 -0.7568025 -0.9589243
Plotting Graphs > x <- 1:100 > x <- sin(x)*exp(-x/100) > plot(x,y,type=“l”)
R Script Files • Edit a script file and save (mysource.R) • File New script click • File Open script click • File Saveclick File saved in the current working directory • Source the script file (run the script) • File Source script click > source(“mysource.R”)
Data Files • You can create and edit data files in the same way as R script files. • Use the file name extension .dat (not .R). • The data files will be stored in the working directory. • Arrange the data in columns with a header at the top. V T P 1.000 293.3 1.202 1.053 281.8 1.117… • Read the file into a R data frame using > mydat <- read.table(“myfile.dat”,header=TRUE)
The Power of R • There are many, many statistical and analysis applications available in R. • Use R for analysis and plotting in labs. • You will use R when learning probability and statistics in the 1st year. • R is used in the Fractals and Chaos course in the 2nd year. • R is used to teach Scientific Inference. • Use R for project work in 3rd/4th years.
Things to do now Before you come to your timetabled workshop • Log in to your UoL account • Get the script from http://www.star.le.ac.uk/zrw/compshop • Start R from All Programs • Create a working directory My Documents/Rwork We recommend that you • Download R onto your own laptop http://www.r-project.org/
And finally… • The workshop and laboratory timetable is on Blackboard and on the Laboratory Notice Board – find out YOUR timetable • Go to Room F in the Department of Physics and Astronomy to collect your Laboratory Course Books – NOW Good luck!