ALVEOLAR VENTILATION PERFUSION
360 likes | 408 Views
Explore key points of alveolar ventilation, perfusion, and their ratio in pulmonary circulation. Learn about zones, dead space, and the impact on gas exchange in the lungs.

ALVEOLAR VENTILATION PERFUSION
E N D
Presentation Transcript
KEY POINTS ALVEOLAR VENTILATION–(V A) ALVEOLAR PERFUSION- PULMONARY CIRCULATION (Q) VENTILATION – PERFUSION RATIO (VA/Q) VENTILATION PERFUSION MISMATCH SHUNT DEAD SPACE
Pulmonary Perfusion Pulmonary blood flow 5l/min Total pulmonary blood volume -500ml to 1000ml These volume going to be spreaded all along the alveolar capillary membrane which has 50 to 100 m² surface area
Pulmonary Perfusion Pulmonary blood flow 5l/min Total pulmonary blood volume -500ml to 1000ml These volume going to be spreaded all along the alveolar capillary membrane which has 50 to 100 m² surface area
Distribution of Pulmonary Perfusion Due to gravitational influence the lower – dependent areas receive more blood Upper zone – nondependent areas are less per fused
Pulmonary circulation – Alveolar Perfusion Q ZONE-I: Only exist if Ppa very low in hypovolemia / PA in PEEP ZONE-II: Perfusion α Ppa-PA arterial-alveolar gradient ZONE-III: Perfusion α Ppa-Ppv arterial-venous gradient ZONE-IV: Perfusion α Ppa-Pist arterial-interstitial gradient
Ventilation Ventilation is unevenly distributed in the lungs. Rt lung more ventilated than Lt lung [53% & 47%] Due to gravitational influence on intra plural pr [decreased 1cm/H2O per 3cm decrease in lung height] lower zones better ventilated
Ventilation Due to gravitational influence on intra plural pr [decreased 1cm/H2O per 3cm decrease in lung height] lower zones better ventilated -6 -3 -1 Intra pleural pr
Ventilation pattern - VA Pleural pressure [Ppl] increased towards lower zone Constricted alveoli in lower zones & distended alveoli in upper zones More compliant alveoli towards lower zone Ventilation: distributed more towards lower zone
Ventilation pattern - VA Upper zone: less pleural pressure, distended more & hence less compliant Lower zone: more pleural pressure, less distended, & hence more compliant
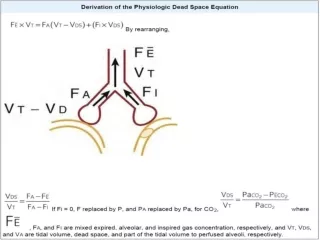
Ventilation Minute Ventilation V = RR x VT Volume of the inspired gas participating in alveolar gas exchange /minute is called ALVEOLAR VENTILATION-VA VA = RR x VT-VD Not all inspired gas participating in alveolar gas exchange DEAD SPACE – VD Some gas remains in the non respiratory airways ANATOMIC DEAD SPACE Some gas in the non per fused /low per fused alveoli PHYSIOLOGIC DEAD SPACE
Distribution of Ventilation Lower zone i.e. dependent part of alveoli are better ventilated than the middle & upper zones i.e. nondependent
Ventilation Dead space ventilation - wasted ventilation ventilation of unperfused alveoli Dead space VD = 2ml/kg ; 1ml /pound Dead space ratioVD/VT = 33% VD = PACO2 – PECO2 VT PACO2
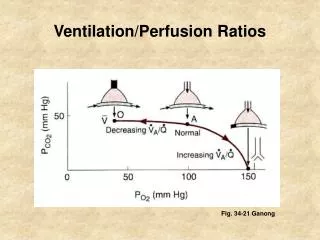
Ventilation Perfusion ratio VA/Q Ventilation & Perfusion both are distributed more towards lower zone. Ventilation[VA] less increased t0wards l0wer zone than Perfusion[Q] Perfusion more increased towards Lower zone than Ventilation Ventilation Perfusion ratio VA/Q: Less towards lower zone VA/Q Q VA
Ventilation Perfusion ratio VA/Q Ventilation & Perfusion both are distributed more towards lower zone. Ventilation[VA] less increased t0wards l0wer zone than Perfusion[Q] Perfusion more increased towards Lower zone than Ventilation Ventilation Perfusion ratio VA/Q: Less towards lower zone VA/Q Q VA
VENTILATION PERFUSION RATIO V V V Q Q Q Wasted ventilation V=normal Q=0 V/Q=∞ DEAD SPACE Wasted Perfusion V=o Q= normal V/Q=0 SHUNT Normal V&Q V/Q=1 IDEAL ALVEOLI
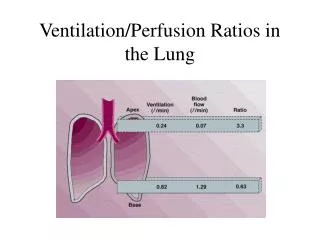
Ventilation Perfusion ratio VA/Q The overall V/Q = 0.8 [ ven=4lpm, per=5lpm] Ranges between 0.3 and 3.0 Upper zone –nondependent area has higher ≥ 1 Lowe zone – dependent area has lower ≤ 1 VP ratio indicates overall respiratory functional status of lung V/Q = 0 means ,no ventilation-called SHUNT V/Q = ∞ means ,no perfusion – called DEAD SPACE
V SHUNT V/Q<1 Q Means – Wasted perfusion Shunt – 1. Absolute Shunt : Anatomical shunts – V/Q = 0 2. Relative shunt : under ventilated lungs –V/Q ≤ 1 Shunt estimated as Venous Admixture Venous Admixture expressed as a fraction of total cardiac output Qs/Qt Qs = CcO2-CaO2 Qt CcO2-CvO2 Normal shunt- Physiologic shunt < 5%
SHUNT SHUNTS have different effects on arterial PCO2 (PaCO2 ) than on arterial PO2 (PaO2 ). Blood passing through under ventilated alveoli tends to retain its CO2 and does not take up enough O2. Blood traversing over ventilated alveoli gives off an excessive amount of CO2, but cannot take up increased amount of O2 because of the shape of the oxygen-hemoglobin (oxy-Hb) dissociation curve. Hence, a lung with uneven V̇P relationships can eliminate CO2 from the over ventilated alveoli to compensate for the under ventilated alveoli. Thus, with Shunt, PACO2 -to-PaCO2 gradients are small, and PAO2 -to-PaO2 gradients are usually large.
SHUNT PAO2 is directly related to FIO2 in normal patients. PAO2 and FIO2 also correspond to PaO2 when there is little to no shunt. With no S/T, a linear increase in FIO2 results in a linear increase in PaO2. As the shunt is increased, the S/T lines relating FIO2 to PaO2 become progressively flatter. With a shunt of 50% of QT, an increase in FIO2 results in almost no increase in PaO2 . The solution to the problem of hypoxemia secondary to a large shunt is not increasing the FIO2 , but rather causing a reduction in the shunt (fiberoptic bronchoscopy, PEEP, patient positioning, antibiotics, suctioning, diuretics).
SHUNT PAO2 is directly related to FIO2 in normal patients. PAO2 and FIO2 also correspond to PaO2 when there is little to no shunt. With no S/T, a linear increase in FIO2 results in a linear increase in PaO2. As the shunt is increased, the S/T lines relating FIO2 to PaO2 become progressively flatter. With a shunt of 50% of QT, an increase in FIO2 results in almost no increase in PaO2 . The solution to the problem of hypoxemia secondary to a large shunt is not increasing the FIO2 , but rather causing a reduction in the shunt (fiberoptic bronchoscopy, PEEP, patient positioning, antibiotics, suctioning, diuretics).
VIRTUAL SHUNT CURVES PaO2 FiO2
DEAD SPACE Not all inspired gas participating in alveolar gas exchange DEAD SPACE – VD Some gas remains in the non respiratory airways ANATOMIC DEAD SPACE Some gas in the non per fused /low per fused alveoli PHYSIOLOGIC DEAD SPACE
V DEAD SPACE V/Q= ∞ Q Means – Wasted Ventilation Dead Space estimated as ratio Vd/Vt Dead space expressed as a fraction of total tidal volume Vd/Vt Vd = PACO2-PECO2 Vt PACO2 Normal dead space ratio < 33%
QUANTIFICATION - SHUNT • CcO2-Pulmonary end capillary O2 content • CaO2-Arterial O2 content • CvO2-Mixed venous O2 content 1. SHUNT RATIO Qs = CcO2-CaO2 Qt CcO2-CvO2 2. MODIFIED = CcO2-CaO2 [CcO2-CaO2]+4 PcO2=PAO2 PAO2=PiO2-PaCO2/0.8 =FiO2x6 PiO2 =PB-PH2OxFiO2 CaO2 = O2 carried by Hb + Dissolved O2 in plasma = 1.34 x Hb% x SaO2 + 0.003 x PaO2
QUANTIFICATION - SHUNT 3. ALVEOLAR – ARTERIAL O2 GRADIENT : PAO2-PaO2 Varies with FiO2 & age 7-14 to 31-56mm Hg 4. ARTERIAL – ALVEOLAR RATIO : PaO2/PAO2 FiO2 independent >0.75 -normal 0.40-0.75-acceptable 0.20-0.40– poor < 0.20 –very poor
QUANTIFICATION - SHUNT 5. ARTERIAL O2 INSPIRED O2 RATIO : PaO2/FiO2 Normally >500mmHg Acceptable 250-500 P00r 100-250 Terminal <100 LI Score: <300ALI, <200ARDS SAPS 2
QUANTIFICATION - SHUNT 6. ISO SHUNT TABLE 7. VIRTUAL SHUNT DIAGRAGME PaO2 FiO2
QUANTIFICATION – DEAD SPACE 1. Vd = PACO2-PECO2 Vt PACO2 2. MV x PaCO2 Body Wt <5 -normal >8 increased dead space 3. PaCo2- EtCO2 GRADIENT 2-5 mmHg
Ventilation Perfusion ratio VA/Q V̇P inequalities have different effects on arterial PCO2 (PaCO2 ) than on arterial PO2 (PaO2 ). Blood passing through under ventilated alveoli tends to retain its CO2 and does not take up enough O2. Blood traversing over ventilated alveoli gives off an excessive amount of CO2 but cannot take up a proportionately increased amount of O2 because of the flatness of the oxygen-hemoglobin (oxy-Hb) dissociation curve in this region. Hence, a lung with uneven V̇P relationships can eliminate CO2 from the over ventilated alveoli to compensate for the under ventilated alveoli. Thus, with uneven V̇P relationships, PACO2 -to-PaCO2 gradients are small, and PAO2 -to-PaO2 gradients are usually large.