Download
1 / 43
430 likes | 590 Views
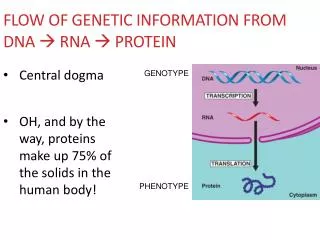
Use of DNA information in Genetic Programs. Outline. DNA Information in Genetic Evaluation: DNA Tests Inclusion in Genetic Evaluations Commercial Ranch Genetic Evaluations Sorting Bulls on DNA Genotyping DNA Parent identification. DNA Test Terminology.

E N D
Outline • DNA Information in Genetic Evaluation: • DNA Tests • Inclusion in Genetic Evaluations • Commercial Ranch Genetic Evaluations • Sorting Bulls on DNA Genotyping • DNA Parent identification
DNA Test Terminology Discovery, Validation, Assessment and Application Discovery: Process of identifying QTL Validation: Process of replicating results in independent data through blind testing Assessment: Process of evaluating the effect of the QTL in a broader context (other traits and environments) Application: Process of using the DNA information in genetic decisions
DNA Tests for Carcass Merit Traits • Thyroglobulin • Calpain (MARC Discovery) • Calpistatin • Leptin • Three QTL from NCBA Carcass Merit Project (genes unknown) • DGAT1
Marker Assisted EPD’s • EPD • Expected Haplotype Effect given sire genotype • Polygenic effect
Sire Genotype DamHaplotype Sire Haplotype Progeny Genotype Progeny Genotype Progeny Phenotype Progeny Phenotype Progeny Genotype vs. Sire Genotype
Commercial Ranch Project and the need for using DNA in sire assignments.
Create genetically diverse groups. Objective: is to maximize the probability of uniquely identifying one sire to a calf.
Outline • DNA Information in Genetic Evaluation: • DNA Tests • Inclusion in Genetic Evaluations • Commercial Ranch Genetic Evaluations • Sorting Bulls on DNA Genotyping • DNA Parent identification
Verification Verification: Verifying that the putative parent is the real parent. In the seedstock industry, pedigree integrity is the primary reason for DNA testing for parent verification AI sires, ET cows and calves, random checks.
Identification Identification: Identifying a parent from a group of potential parents (e.g., multiple-sire breeding pastures).
Practical Application We are currently developing a program for genetic evaluation for the commercial sector. A problem is that the large commercial ranches use multiple-sire pastures so DNA testing for identification becomes necessary.
A mismatch between the genotype of the putative sire and the calf in question. Sire = 110/110 Calf = 112/114 Perfect World Begin by assuming that genotypes are scored without error. Process of excluding bulls.
Panel Exclusion Rate Measure of the effectiveness of a DNA panel to exclude an animal as a parent. Probability of excluding as the parent any animal drawn at random from the population.
Sire Identification The probability of uniquely identifying the sire in a group of “N” bulls is: ( Exclusion rate ) N
Multiple Qualifying Sires Could run more markers (a second panel). If this was a seedstock problem probably would. In the commercial program however this is not cost effective, so we compute the probability that each qualifying sire is the true sire.
Commercial Genetic Evaluation Using probabilities then requires a system for genetic evaluation that “models” sire uncertainty. Under a sire uncertainty model do not need to uniquely identify the sire. We will use the probability associated with each bull of being the sire.
Probabilities Competing sires Bull 1 = 110/110 Bull 2 = 110/112 Calf = 110/114 If Bull 1: P(110) =1 If Bull 2: P(110) =0.5
Probabilities Competing sires Bull 1 = 220/222 Bull 2 = 224/228 Dam genotype 224/224 Calf = 220/224 Bull 1: P(220)=0.5 Bull 1: P(224)=0.5
Two Qualifying Bulls Bull 1: P(locus one) = 1.0 P(locus two) = 0.5 0.5 of his calves will have the calf genotype in question. Locus 1: 110/114 Locus 2: 220/224
Two Qualifying Bulls Bull 2: P(locus one) = 0.5 P(locus two) = 0.5 0.25 of his calves will have the calf genotype in question. Locus 1: 110/114 Locus 2: 220/224
Two Qualifying Bulls Bull 1 = 0.50 Bull 2 = 0.25 Bull 1 is twice as likely as bull 2 to be the sire so the probability of each bull is then: Bull 1 = 2/3 Bull 2 = 1/3
Example: Bell Ranch Data AID Sire Prob Excl Sire Prob Excl
A mismatch between the genotype of the sire and calf in question does not exclude the bull. Sire = 110/110 Calf = 112/114 Real World Scoring genotypes is NOT a process without error.
Types of Scoring Errors Independent of genotype (2-base pair repeats): Base pair mis-reads (usually two bases off) More likely in large DNA repeat segments Dependent of genotype (2-base pair repeats): Heterozygotes for alleles differing by two bases are read as a homozygote for the smaller allele: genotype 110/112 => scored as 110/110
A mismatch between the genotype of the sire and calf in question does not exclude the bull. Sire = 110/110 Calf = 112/114 Real World Experience 10 - 15% chance he still qualifies
The Phenotypic Representation of a Sire Identification Problem Animal Scored Genotype Animal Genotype Will use a four allele locus as an example.
The Phenotypic Representation of a Sire Identification Problem Animal Scored Genotype Animal Genotype P(A1) = 0.5-E P(A2) = 0.5-E P(A3) = E P(A4) = E E = simple independent error rate Bull 1: A1/A2
Population Frequencies Possible Alleles 108 (.4) 110 (.3) 112 (.2) 114 (.1)
Assume 4% error Sire Possible Alleles 108(0.48) 110(0.48) 112 (0.02) 114 (0.02) Genotyping Errors Sire Scored Genotype = 108/110
The Phenotypic Representation of a Sire Identification Problem Animal Scored Genotype Animal Genotype P(A1) = 0.5-E P(A2) = E P(A3) = E P(A4) = 0.5-E E = simple independent error rate Calf: A1/A4