1 / 4

Average = -0.002 ± 0.186 ppmv

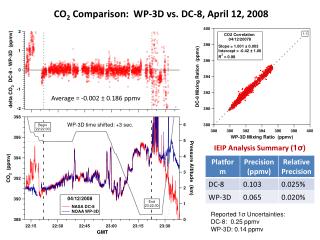
CO 2 Comparison: WP-3D vs. DC-8, April 12, 2008. Average = -0.002 ± 0.186 ppmv. WP-3D time shifted: +3 sec. IEIP Analysis Summary ( 1 σ ). Reported 1 σ Uncertainties: DC-8: 0.25 ppmv WP-3D: 0.14 ppmv. Prudhoe Bay Plume inhomogeneity. Differences in Sampling of Fine Plume Structures.

ralph
Download Presentation

Average = -0.002 ± 0.186 ppmv

An Image/Link below is provided (as is) to download presentation Download Policy: Content on the Website is provided to you AS IS for your information and personal use and may not be sold / licensed / shared on other websites without getting consent from its author. Content is provided to you AS IS for your information and personal use only. Download presentation by click this link. While downloading, if for some reason you are not able to download a presentation, the publisher may have deleted the file from their server. During download, if you can't get a presentation, the file might be deleted by the publisher.

E N D

Presentation Transcript


  1. CO2 Comparison: WP-3D vs. DC-8, April 12, 2008 Average = -0.002 ± 0.186 ppmv WP-3D time shifted: +3 sec. IEIP Analysis Summary (1σ) Reported 1σ Uncertainties: DC-8: 0.25 ppmv WP-3D: 0.14 ppmv

  2. Prudhoe Bay Plume inhomogeneity

  3. Differences in Sampling of Fine Plume Structures

  4. CO2 Comparison: NASA DC-8 vs. DLR Falcon – 07/09/2008 Distance < 200 m IEIP Analysis Summary (1σ) Reported 1σ Uncertainties: DC-8: 0.25 ppmv Falcon:

More Related