Download

1 / 48
550 likes | 715 Views
World Fertilizer N Consumption and Challenges. Nitrogen Use Efficiency Conference Stillwater, Oklahoma August 3, 2010. C.S. Snyder, PhD, CCA Nitrogen Program Director. Background. N is essential to the survival of all life

E N D
World Fertilizer N Consumption and Challenges Nitrogen Use Efficiency Conference Stillwater, Oklahoma August 3, 2010 C.S. Snyder, PhD, CCA Nitrogen Program Director
Background • N is essential to the survival of all life • Over 40% of the people on Earth owe their existence to the food production made possible by N fertilizers • “Human alterations of the N cycle have caused a variety of environmental and human health problems ranging from too little to too much reactive N in the environment.” (Woods Hole Research Center) • half the synthetic N fertilizer ever used has been utilized since 1985 (Howarth, 2005). http://www.whrc.org/policy/global_nitrogen.htm
A Growing World Population Requires an Increased Global Food Supply ”Stewart et al. (2005) reviewed data representing 362 seasons of crop production and reported at least 30 to 50% of crop yield can be attributed to commercial fertilizer inputs.” “…food production will have to increase by 50% by 2013 and double in 30 years to help solve the current food crisis.” (Roberts. 2009. Better Crops 93(2):12-15)
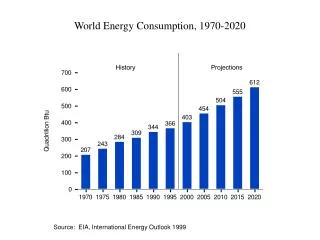
World Fertilizer N Consumption, 1961-2007 IFA Statistics 2010
World Fertilizer N Consumption by Source IFA Statistics 2010
U.S. N Source Consumption: 1970-2007 Source: H. Vroomen -TFI, and AAPFCO
World and U.S. Fertilizer N Consumption World U.S. Source: IFA Statistics, 2010
U.S. Fertilizer N Consumption 0.5% increase per year, since 1980 Source: AAPFCO and TFI, 2010
Source: Heffer. 2009. Assessment of Fertilizer Use by Crop at the Global Level: 2006/07 – 2007/08 . IFA. Paris, France
Fertilizer, 31 Tg N Increased N Inputs and Global N FlowsPose Environmental Challenges Galloway et al. 2008. Science 320, 889 Grain, 12 Tg N Meat, 0.8 Tg N 1 Tg = 1 million tonnes (Mt)
Global N Use Efficiency • Can be defined many different ways • Ladha et al. 2005. Advances in Agronomy 87: 85-176. • Dobermann. 2007.IFA Workshop on Fertilizer BMPs. Brussels, Belgium. March 7-9, 2007. • Worldwide fertilizer N use efficiency in cereal production was estimated at 33% (Raun and Johnson. 1999. Agron. J. 91:357–363) • NUE = (est. grain N removal – (est. N from soil + rainfall)) est. cereal fertilizer N consumption x 100
Global Nitrogen Use Efficiency, Expressed as Apparent N Recovery (REN) • <50% N use efficiency globally by most crops (Balasubramanian et al., 2004; Ladha et al., 2005) • typical on-farm REN (Dobermann and Cassman, 2002) • only 30% in rice and 37% in maize, • with good management REN could be 50 to 80% • in cereal crop research • total REN from a one-time application of N averages 50 to 60%, and 40 to 50% under most on-farm conditions (Dobermann, 2007) CF Industries OSU
Kitchen and Goulding (2001) inNitrogen in the Environment: Sources, Problems and Management • “ nitrogen use efficiency …rarely exceeds 70% ……. often ranges from 30-60%” • “conversion of N inputs to products for arable crops can be 60-70% or even more” EPA SAB Integrated N Committee report on reactive N (Aug. 27, 2009 DRAFT): recommends crop N-uptake efficiencies increase by up to 25% over current practices, through a combination of knowledge-based practices and advances in fertilizer technology
How Much N Loss via Major Pathways ? • Runoff, leaching and drainage • Ammonia volatilization • Denitrification and N2O emissions (direct and indirect)
Education & Natural Resources District Regulation Help Lower Groundwater NO3Central Platte Valley, Nebraska Source: Personal communication with Richard Ferguson (2010) For more info refer to Exner et al.2010. The Scientific World Journal 10:286-297.
River N Flux is Predicted to Increase with Increased N Inputs (Bouwman et al., 2005) 1 Tg = 1 million tons (Mt)
USGS Estimates of Loss and Delivery of N and P to the Gulf of Mexico SPARROW - Modeled Estimate of N and P Discharge in Watersheds of the Mississippi R. Basin kg/ha .001 .001- 0.01 0.01 to 0.1 0.1 to 0.5 0.5-1.0 >1 kg/ha .01 .01- 0.1 0.1 to 1 1 to 5 5 to 10 >10 Alexander et al. Environ. Sci. Technol. 2008, 42, 822–830
2015 Hypoxia Goal Gulf of Mexico Hypoxia Areanew Aug. 2, 2010 Square miles of hypoxia No Data 15 Year Hypoxia data from N. Rabalais, LUMCON
Hypoxic Zones Are Increasing Globally Diaz and Rosenberg. 2008. Science 321:926-929
NH3 Volatilization Losses from N Fertilizers • Up to 45% of the urea-N applied under surface-applied, warm, moist field conditions can be lost as NH3(Watson, 2005) • Volatilization of NH3 from N fertilizers has been estimated by Bouwman et al. (2002) at: • 18% in developing countries, based on N sources used and environmental conditions, • 7% in industrialized countries • Estimated global median NH3 loss • 14% for fertilizer N • 23% for manure N • NH3 volatilization loss has exceeded • 50% of applied urea N in transplanted rice paddy systems in Asia • 30% of the applied N if flooding is delayed for up to 14 days after urea is surface broadcast in drill-seeded flood-irrigated rice
2008 Total U.S. GHG Emissions, based on CO2 equivalents 2007 Total EU-27 GHG Emissions, based on CO2 equivalents Agriculture share 6% of all U.S. GHG emissions Agriculture share 9% of all EU-27 GHG emissions Radiative Forcing (GWP) N2O x 296 = CO2e CH4 x 23 = CO2e U.S. EPA Inventory of GHG Emissions and Sinks,1990 – 2008 (2010) European Environment Agency. 2010. Greenhouse gas emission trends and projections in Europe 2009
U.S. GHG Emissions & N2O from Ag Soil Management(EPA 2010 U.S. GHG inventory, 1990-2008) Ag soil mgmt. 4% in EU-27 in 2007 3.3% 3.4% 3.5% 3.5% 3.6% 3.7% 3.9% Agricultural soil management N2O as portion of total U.S. GHG emissions Agricultural soil management includes fertilizer application and cropping practices; the largest sources of N2O emissions, accounting for 68% of all U.S. N2O emissions in 2008 1 gigaton (Gt) = 109 tonnes = 1012 kg = 1015 g = 1,000 Tg = 1018 g 1 terragram (Tg) = 1012 g = 109 kg =106 tonnes
Source: Flynn and Smith. 2010. Greenhouse gas budgets of crop production – current and likely future trends. IFA. Paris, France
Nitrous Oxide (N2O) Emissions from Agricultural Soils, 1990-2020 (EPA, 2006)
4R Nutrient Stewardship Crops & Soils 42(2): Mar-Apr 2009 http://www.ipni.net/4r Crops & Soils 42(3): May-Jun 2009 Crops & Soils 42(4): Jul-Aug 2009 Know Your Fertilizer Rights: Right Place by T.S. Murrell (IPNI), G.P. Lafond (AAFC), and T.J. Vyn (Purdue U.) Crops & Soils 42(5): Sep-Oct 2009 Crops & Soils 42(6): Nov-Dec 2009
Agriculture, Ecosystems and Environment (2009) 133:247-266. Fertilizer N : source, rate, timing, and place of application
N Rates Used by Farmers on Corn ?USDA NASS/ERS and Corn N Rate Calculator • USDA: average N rate applied for corn in 2000-2005 was 135 lb/A (151 kg/ha) • N Rate Calculator: @ $0.36/lb of N and $3.60/bu of corn: 2005 applied,MRTN, lb N/Alb N/A (NASS) • Illinois 168 146 • Indiana 171 147 • Iowa 125 141 • Michigan 130 128 • Minnesota 105 139 • Ohio 174 161 • 6-state ave. = 146 144
Fertilizer N Effects on Profile SOC After 39 Years of Continuous Corn with a Winter Cereal Cover Crop Grove et al. 2010. Better Crops 93(4):6-8
Duration III and ESN = Polymer Coated urea SuperU and UAN+AP contain urease and nitrification inhibitors 20 to 50 % reduction possible with N source selection 192 bu/A 1 Mg/ha =15.9 bu/A Corn grain yield (Mg/ha) is shown near the bottom of each bar Source: Halvorson et al., 2009 Better Crops 93(1):16-18; Submitted to JEQ on Feb. 1, 2010.
N Source Affects Growing Season N2O and CO2 Emissions, and Corn Yields (MN) • N rate = 146 kg N/ha, • in spring 1-2 weeks before planting: • NH3 knifed, urea bdcst. & incorporated N2O emissions with urea were half of those with anhydrous ammonia “It is likely that the effects of fertilizer form will be site specific and depend to some extent on soil pH.” Venterea et al. 2010. Soil Sci. Soc. Am. J. 74:407–418
N2O Emissions Tend to Increase as N Rates Increase (Halvorson et al., 2009. Better Crops 93:16-18)
N Rate Effects on Daily N2O Flux in Corn (8-site-years, MI) Millar et al. 2010. Mitig. Adapt. Strateg. Glob. Change. 15:185–204.
Is Lower Input, Less Intensive Ag the Answer? Snyder et al. 2009. Agric. Ecosyst. Environ. 133:247-266
More Intensive Systems Can Help Lower GWP per Unit of Food Produced- Ecological Intensification - Snyder et al. 2009. Agric. Ecosyst. Environ. 133:247-266
More Intensive Systems Can Help Lower GWP per Unit of Food Produced 4X more food Snyder et al. 2009. Agric. Ecosyst. Environ. 133:247-266
The Key is to Limit Potential “Surplus N” “ … agricultural management practices to reduce N2O emissions should focus on optimizing fertilizer-N use efficiency under median rates of N input, rather than on minimizing N application rates.” Van Groenigen et al. 2010. Europ. J. Soil Sci. doi: 10.1111/j.1365-2389.2009.01217.x
Will Variable-Rate N Using Canopy Sensors Deliver Environmental Benefits? Source: Roberts, Kitchen, Scharf & Sudduth. 2010. Agron. J. 102: 85-95
Each dollar invested in higher crop yields has resulted in 68 fewer kg of C (249 kg CO2e) emitted. Stanford University Source: Burney et al. 2010. Proc. Natl. Acad. Sci. 107(26):12052-12057
A Preliminary Nutrient Use Geographic Information System (NuGIS)for the U.S. 2010
Estimated N balance by watershed, 1987. IPNI, 2010
Estimated N balance by watershed, 1992. IPNI, 2010
Estimated N balance by watershed, 1997. IPNI, 2010
Estimated N balance by watershed, 2002. IPNI, 2010
Estimated N balance by watershed, 2007. IPNI, 2010
Improving N Use Efficiency • Implementation of fertilizer best management practices (BMPs) • Site-Specific Nutrient Management (SSNM) - to help achieve improved economic results and environmental objectives
Thank You www.ipni.net Better Crops, Better Environment … through Science