Download

1 / 31
0 likes | 1 Views
Compare performance KPIs such as average service turnaround, pricing index, and digital readiness across UAE aftermarket leaders.<br>https://www.kenresearch.com/sample-report/uae-automotive-aftermarket?utm_source=ppt/pdf&utm_medium=referal&utm_campaign=rajni

E N D
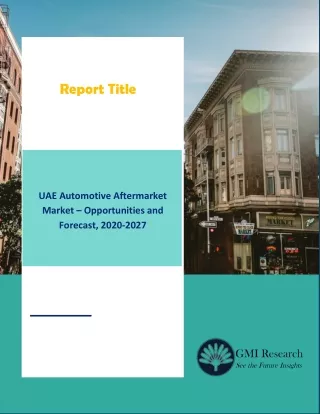
September 2025 Uae Automotive Aftermarket Service Industry Outlook To 2026 Driven by increasing number of startups and consumers shifting preference towards online and organized sector Author: Gagan Sawhney, Tania Bansal | Vertical: Automotive, Transportation and Warehousing | Region: Middle East Shaped by Rising Vehicle Parc and Ageing Fleet, Technological Advancements (Telematics, Diagnostics), Regulatory Push on Safety & Emissions.
Table of Contents 1 1. Executive Summary 1.1 Executive Summary of Uae Automotive After Market 2 2. Market Overview: UAE Automotive Aftermarket Service Industry Outlook to 2026 2.1. Market Defjnition and Scope 2.2. Historical Market Size (2016–2021) 2.3. Current Market Size (2021) 2.4. Market Forecast (2021–2026) 2.5. Key Market Drivers and Restraints Summary 3 3. Market Segmentation of Uae Automotive After, 2025 3.1 Segmentation by Service Type: (Maintenance & Repair, Spare Parts, Accessories, Tires, Batueries & Lubricants) 3.2 Segmentation by Distribution Channel: (Independent Repair Shops, OEM Dealerships & Authorized Centers, Online/E- Retailers, Specialty Retailers & Warehouse Clubs) 3.3 Segmentation by Vehicle Type: (Passenger Cars, Light Commercial Vehicles (LCVs), Heavy Commercial Vehicles (HCVs), Two-Wheelers) 3.4 Segmentation by End-User: (B2C, B2B) 3.5 Segmentation by Geography (Emirate): (Abu Dhabi, Dubai, Sharjah, Northern Emirates) 4 4. Industry Analysis 4.1. Growth Value Drivers 4.1.1. Rising Vehicle Parc and Ageing Fleet 4.1.2. Technological Advancements (Telematics, Diagnostics) 4.1.3. Regulatory Push on Safety & Emissions 4.1.4. Increasing Consumer Spend on Vehicle Uptime 4.1.5. Digitalization and E-commerce Adoption 4.2. Industry Challenges 4.2.1. Skilled Labor Shortage 4.2.2. Complex Import/Customs Procedures 4.2.3. Fragmented Supply Chain 4.2.4. Price Sensitivity and Margin Pressure 4.2.5. Aftermarket Counterfeit Parts
4.3. Opportunities 4.3.1. Electric Vehicle (EV) Service Infrastructure 4.3.2. Predictive & Preventive Maintenance via IoT 4.3.3. Mobile Service Vans and On-demand Repairs 4.3.4. Value-added Digital Platforms and Subscriptions 4.3.5. M&A and Consolidation Play 4.4. Emerging Trends 4.4.1. Contactless Service & Remote Diagnostics 4.4.2. Subscription-based Maintenance Packages 4.4.3. ADAS Calibration & Software Updates 4.4.4. Sustainable & Green Repair Solutions 4.4.5. Integration of AI and Augmented Reality in Workshops 5 5. Value Chain and Industry Taxonomy 5.1. Raw Material and Component Suppliers 5.2. Original Equipment Manufacturers (OEMs) 5.3. Aftermarket Parts Manufacturers 5.4. Distributors and Wholesalers 5.5. Service Providers (Dealers, Independents, Chains) 5.6. End Users (Fleet Operators, Retail Consumers) 6 6. Regulatory Framework 6.1. Federal Trafgic and Safety Regulations 6.2. Emirates Authority for Standardization and Metrology (ESMA) Standards 6.3. Environmental and Emissions Norms 6.4. Import Duties & Customs Regulations 6.5. Professional Licensing and Certifjcation Requirements 7 7. Competitive Landscape of the Uae Automotive After 7.1 Major Companies Covered: (Al-Futuaim Automotive Group, Arabian Automobiles Co., Al Tayer Motors, Al Nabooda Automobiles, Gargash Enterprises, and Others) 7.2 Operational Parameters: (Company, Headquarter, Market Share (USD Mn), Revenue Growth Rate, EBITDA Margin, After-sales Service Revenue (USD Mn), and Others) 7.3 Financial Parameters: Market Shares, Revenues, and Profjt Margins 8 8. Future Market Segmentation of Uae Automotive After, 2030
8.1 Segmentation by Service Type: (Maintenance & Repair, Spare Parts, Accessories, Tires, Batueries & Lubricants) 8.2 Segmentation by Distribution Channel: (Independent Repair Shops, OEM Dealerships & Authorized Centers, Online/E- Retailers, Specialty Retailers & Warehouse Clubs) 8.3 Segmentation by Vehicle Type: (Passenger Cars, Light Commercial Vehicles (LCVs), Heavy Commercial Vehicles (HCVs), Two-Wheelers) 8.4 Segmentation by End-User: (B2C, B2B) 8.5 Segmentation by Geography (Emirate): (Abu Dhabi, Dubai, Sharjah, Northern Emirates) 9 9. Analyst Recommendations 9.1. Total Addressable Market (TAM), Serviceable Available Market (SAM), Serviceable Obtainable Market (SOM) Analysis 9.2. Entry and Expansion Strategies 9.3. Mergers & Acquisitions and Partnership Opportunities 9.4. Technology Adoption and Capex Priorities 9.5. Risk Mitigation Framework 10 10. Research Methodology 10.1. Data Sources (Primary & Secondary) 10.2. Research Process and Timeline 10.3. Forecasting Model and Assumptions 10.4. Data Validation and Quality Assurance 10.5. Expert Interviews and Workshops 11 11. Disclaimer 12 12. Contact Us
01 Executive Summary
Executive Summary Exhibit 1.1 Taxonomy & Market Size of UAE Automotive Aftermarket UAE Automotive Aftermarket (USD XX Bn) By Service Type By Distribution Channel Maintenance & Repair XX% Spare Parts XX% Accessories XX% Independent Repair Shops XX% OEM Dealerships & Authorized Centers XX% Online/E-Retailers XX% Covers Includes engine, transmission, and braking parts. Ofgers interior, exterior, and performance accessories. Includes multi- brand and single- brand service centers. Comprises 3S/4S dealerships and quick-service outlets. Features pure- play marketplaces and brand- owned portals. scheduled and unscheduled vehicle maintenance services. Engine Parts (XX%) Interior (XX%) Multi-brand Service Centers (XX%) 3S/4S Dealerships (XX%) Pure-play Marketplaces (XX%) Scheduled Maintenance (XX%) Transmission Parts (XX%) Exterior (XX%) Brand-owned Quick-Service Outlets (XX%) Single-brand Specialists (XX%) Brand-owned E-commerce Portals (XX%) Unscheduled Repair (XX%) Performance (XX%) Braking Parts (XX%) Mobile/Pick-up & Drop-ofg Services (XX%) By Vehicle Type Passenger Cars Light Commercial Vehicles (LCVs) Heavy Commercial Vehicles (HCVs) Two-Wheelers By End-User B2C B2B By Geography (Emirate) Abu Dhabi Dubai Sharjah Northern Emirates Source: Ken Research Analysis Note 1: Exhibits are illustrative; detailed numbers appear in the full report. Note 2: XX% denotes CAGR. COPYRIGHT KEN RESEARCH. ALL RIGHTS RESERVED
02 UAE Automotive After Market Outlook
UAE Automotive After Market Outlook UAE Automotive After Market Scenario Rising demand for personalized maintenance, supportive government initiatives and rapid digital integration are underpinning the UAE’s automotive aftermarket services, where an aging vehicle fleet and tourism-driven usage have catalyzed robust service volumes. The shift to electric and hybrid models, telematics-enabled diagnostics and mobile service platforms define the latest trends, while value drivers include government incentives, tech-enabled predictive maintenance and standardized parts ecosystems. Expo-driven infrastructure upgrades and regional trade corridors serve as key tailwinds, with AI-powered diagnostics and aftermarket consolidation poised as catalysts to 2026. Probable scenarios range from subscription-based services to omnichannel digital platforms and green service hubs emphasizing sustainability. Exhibit 2.1 Illustrative UAE Automotive After Market Overview CAGR: XX% XX% XX% XX% XX% XX% XX% XX% XX% XX% XX% XX% XX% 2025 2030 By Service Type Maintenance & Repair Spare Parts Accessories Independent Repair Shops Online/E-Retailers OEM Dealerships & Authorized Centers By Distribution Channel Source: Ken Research Analysis Note 1: The exhibit serves as an illustration, with numbers currently masked. The detailed statistics will be included in the final report. Note 2: All revenue and financial numbers are for current year and financial year, i.e., 2025 & 2030. Note 3: XX% in the above exhibit denotes market size. COPYRIGHT KEN RESEARCH. ALL RIGHTS RESERVED
03 Market Segmentation of UAE Automotive After Market
Market Segmentation of UAE Automotive After Market UAE Automotive After Market Segmentation By Service Type, Maintenance & Repair and Spare Parts topped the UAE aftermarket with XX% share in 2021, driven by Scheduled Maintenance and Braking Parts demand. Under By Distribution Channel, Independent Repair Shops led volumes, while OEM Dealerships & Authorized Centers leveraged 3S/4S Dealerships to expand high-margin services. By Vehicle Type, Passenger Cars dominated, buoyed by rising EV aftercare opportunities. By End-User, B2C accounted for the majority of service visits amid growing digital engagement. By Geography (Emirate), Dubai emerged as the fastest-growing market. Online/E-Retailers accelerated parts delivery through Brand-owned E-commerce Portals, and Tire-only Retail Chains forged partnerships to optimize logistics. Exhibit 3.1 Illustrative Market Segmentation of UAE Automotive After Market Two-Wheelers XX% Northern Emirates XX% Mobile/Pick-up & Drop-ofg Services (XX%) Accessories XX% Spare Parts (XX%) Online/E-Retailers XX% B2B XX% Heavy Commercial Vehicles (HCVs) XX% Sharjah XX% OEM Dealerships & Authorized Centers XX% Unscheduled Repair (XX%) Single-brand Specialists (XX%) Spare Parts XX% Light Commercial Vehicles (LCVs) XX% Dubai XX% B2C XX% Maintenance & Repair XX% Scheduled Maintenance (XX%) Independent Repair Shops XX% Multi-brand Service Centers (XX%) Passenger Cars XX% Abu Dhabi XX% By Service Type Maintenance & Repair By Distribution Channel Independent Repair Shops By Vehicle Type By End-User By Geography (Emirate) Key Takeaways: Maintenance & Repair and Spare Parts are leading the market. Independent Repair Shops dominate the distribution channel. Passenger Cars are the most serviced vehicle type. Dubai is the fastest-growing emirate in the market. Source: Ken Research Analysis Note 1: This exhibit serves as a visual representation. The fjnal chart will include additional segments along with detailed statistics in the fjnal report. Note 2: All revenue and fjnancial numbers are for the current year. Note 3: "XX%" in the above exhibit denotes market shares. COPYRIGHT KEN RESEARCH. ALL RIGHTS RESERVED
04 Overview And Genesis Of The Uae Automotive After Market
Overview And Genesis Of The Uae Automotive After Market Uae Automotive After Market Ecosystem Ecosystem of the UAE automotive aftermarket service industry comprises three tiers: large, medium, small enterprises. Large enterprises—OEM franchise dealers—leverage global manufacturer partnerships to operate warranty, branded parts distribution and authorized repair networks; they compete on quality and brand trust, generating high-margin service fees and OEM parts sales. Medium enterprises—regional multi-brand chains—partner with Tier-1 suppliers and insurers; they offer preventive maintenance and general repairs at competitive pricing; revenue is driven by service bundles and parts markups. Small enterprises—local workshops—source from independent suppliers and focus on basic repairs and quick fixes, serving price-sensitive customers; revenue derives from hourly labor and generic parts sales. Exhibit 4.1 Illustrative Ecosystem of Uae Automotive After Market Entity type Revenue Streams Players Al-Futtaim Motors (Toyota, Lexus, Honda) Al-Tayer Motors (Ford, Jaguar / Land Rover, Ferrari) Gargash Motors (Mercedes-Benz) Al-Nabooda Automobiles (Audi, Porsche, VW) Sale of genuine parts & accessories Scheduled/preventive maintenance packages Warranty, recall & extended‐service contracts Diagnostics, calibration & collision repairs ▶ ▶ OEM-affiliated Dealerships & Authorized Service Centers ▶ ▶ Labor charges for general mechanical work Aftermarket parts installation Vehicle inspections & diagnostics Body, paint, detailing & upholstery services ▶ MyCar PitStop Car Doctor Speedmaster ▶ Independent Repair & Maintenance Workshops ▶ ▶ Wholesale of OEM & third-party aftermarket parts Inventory financing & consignment stock Private-label sourcing & bundling (e.g. repair kits) Co-marketing / trade-promotion services Symbio Al Masaood Al-Shirawi Autocare Gulf Marketing Group (GMG) ▶ ▶ Parts Distributors & Wholesalers ▶ ▶ Retail sales of bulbs, filters, belts, batteries, etc. Online store sales & drop-ship fulfillment DIY kits & installation fees Seasonal promotions & value-packs ▶ SparePartsSouq A2Z Parts SparesHub Camel Spare Parts Parts & Accessories Retailers (Brick-&-Mortar & E- commerce) ▶ ▶ ▶ Marketplace / booking-portal fees & commissions Subscription fees for workshop listings Lead-generation, targeted advertising & data analytics Value-added services (fleet management, financing) ▶ Autochek YallaMotor CarSwitch SellAnyCar ▶ Digital Platforms & B2B/B2C Aggregators ▶ ▶ Tire sales, fitting & balancing Battery testing, replacement & recycling Windshield & glass repair/replacement Oil‐change, fluid exchange, HVAC servicing ▶ Goodyear AutoCare Bridgestone ME AAA Battery AccuSure Glass ▶ Specialized Aftermarket Service Providers ▶ ▶ Aramex DHL Supply Chain Parts transportation & JIT delivery ▶ COPYRIGHT KEN RESEARCH. ALL RIGHTS RESERVED
Entity type Revenue Streams Players Bonded / cold‐chain warehousing Customs clearance & import-export facilitation Reverse logistics & returns management ▶ Gulf Warehousing Company Agility Logistics Logistics & Supply-Chain Providers ▶ ▶ COPYRIGHT KEN RESEARCH. ALL RIGHTS RESERVED
05 Competitive Landscape
Competitive Landscape (1/3) Competitive Landscape Overview In the UAE aftermarket landscape, Al-Futtaim Automotive, Al-Tayer Group, Al Habtoor Motors and digital‐native ServiceMyCar dominate. Al-Futtaim’s canvas centers on OEM partnerships, certified workshops, extensive retail networks, digital booking, mid-to-high-end segments, service fees and parts sales. Al-Tayer leverages multibrand franchises, exclusive vendor ties, premium showrooms, mobile service vans, loyalty programs and subscription maintenance. Al Habtoor integrates import & distribution, brand-led dealerships, trained technicians, omnichannel scheduling and fleet contracts to drive parts & labor margins. ServiceMyCar’s model emphasizes aggregator partnerships, on-demand valet repairs, proprietary app, data analytics, urban private/government fleets and commission-based revenues. All compete on network coverage, service quality and digital convenience. Exhibit 5.1 Illustrative Market Shares of Key Players in UAE Automotive After Market Note: These are illustrative representations and do not reflect actual data or real-world figures Source: Ken Research Analysis Note 1: The XX% in the exhibit represents the market share of each company. Note 2: The exhibit serves as an illustration, with numbers currently masked. Note 3: All revenue and fjnancial numbers are for the current year. COPYRIGHT KEN RESEARCH. ALL RIGHTS RESERVED
Competitive Landscape (2/3) Exhibit 5.2 Illustrative Competition Matrix of Uae Automotive After Market Major Players in Uae Automotive After Market Figure represents cumulative market share for only the product segment.: Uae Automotive After Market: USD XX Bn Note: These are illustrative representations and do not refmect actual data or real-world fjgures Large Players Medium Players Small Players Source: Ken Research Analysis Note 1: The XX% in the exhibit shows the market share of each company, which represents the company's contribution to the total market. Note 2: The exhibit serves as an illustration, with numbers currently masked. Note 3: All revenue and fjnancial numbers are for the current year. Note 4: Enterprise size categories based on annual revenue in US$—Large > 50 Mn; Medium 10 Mn–50 Mn; Small < 10 Mn. COPYRIGHT KEN RESEARCH. ALL RIGHTS RESERVED
Competitive Landscape (3/3) Exhibit 5.3 Illustrative Cross Comparison of Key Players in Uae Automotive After Market After- sales Service Revenue (USD Mn) Market Share (USD Mn) Revenue Growth Rate Inventory Turnover Ratio Return on Assets Customer Satisfaction Index EBITDA Margin Company Headquarter Al-Futtaim Automotive Group Dubai, UAE XX XX% XX% XX XX XX% XX Arabian Automobiles Co. Dubai, UAE XX XX% XX% XX XX XX% XX Al Tayer Motors Dubai, UAE XX XX% XX% XX XX XX% XX Al Nabooda Automobiles Dubai, UAE XX XX% XX% XX XX XX% XX Gargash Enterprises Dubai, UAE XX XX% XX% XX XX XX% XX Al Masaood Automobiles Abu Dhabi, UAE XX XX% XX% XX XX XX% XX Jacky’s Group Dubai, UAE XX XX% XX% XX XX XX% XX Ali & Sons Trading Co. Abu Dhabi, UAE XX XX% XX% XX XX XX% XX Abu Dhabi Motors Abu Dhabi, UAE XX XX% XX% XX XX XX% XX Premier Motors Abu Dhabi, UAE XX XX% XX% XX XX XX% XX Source: Ken Research Analysis Note 1: The XX% and XX values in the exhibit represent placeholder data and will be replaced with actual figures in the final report. Note 2: All revenue and financial numbers are for the current year. COPYRIGHT KEN RESEARCH. ALL RIGHTS RESERVED
06 Analyst Recommendation
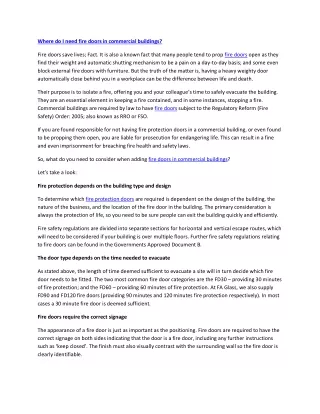
Analyst Recommendation TAM/SAM & SOM Analysis Exhibit 6.1 Target Addressable Uae Automotive Aftermarket Service Industry Outlook To 2026 TAM = USD XX Bn (Sum of projected spend by all UAE-registered vehicles on repair and maintenance services by 2026.) SAM = USD XX Bn (Portion of TAM served by licensed UAE aftermarket providers offering parts and labor through 2026.) SOM = USD XX Bn (Share of SAM realistically attainable by top UAE service operators considering network reach and capacity.) Source: Ken Research Analysis Note 1: The exhibit serves as an illustration, with numbers currently masked. The detailed statistics will be included in the final report. Note 2: All revenue and financial numbers are for the current year. COPYRIGHT KEN RESEARCH. ALL RIGHTS RESERVED
07 Ken Research Ofgerings
How can we add value ? Ken Research Strategy & Transformation ▶ Digital transformation in freight transportation ▶ Portfolio & Growth strategy for freight transportation ▶Regulatory compliance and sustainability standards (ISO 14001, IMO Safety Guidelines, DOT Compliance, FMCSA Regulations, IATA Cargo Regulations, EU Emission Standards, LEED for Green Logistics) Growth and Scale-Up Cost and Performance Excellence Customer Loyalty and Experience Investment Advisory ▶Feasibility studies and investment planning for logistics networks, warehouse automation, and multimodal freight solutions Expansion into AI-driven logistics, autonomous trucking, and blockchain-enabled supply chains Cost optimization through route optimization, fmeet automation, and predictive maintenance Stakeholder engagement: Shippers, logistics providers, government agencies, e- commerce fjrms, manufacturers ▶Expansion into multimodal freight solutions, drone deliveries, and autonomous shipping ▶Investment screening for sustainable logistics startups, smart transportation fjrms, and AI- driven freight tech ▶Growth in AI-powered fmeet management, predictive cargo tracking, and smart logistics platforms ▶AI-driven predictive analytics for demand forecasting, fuel efgiciency, and trafgic congestion analysis ▶Lean logistics methodologies for reduced operational costs, fuel efgiciency, and cargo optimization ▶Funding and capital advisory for sustainable freight solutions, autonomous trucking, and AI- powered logistics innovation ▶Adoption of electric and hybrid fmeets, carbon-neutral shipping, and green freight corridors ▶Digital twin technology for real- time fmeet tracking, route planning, and predictive maintenance Lean workfmow and predictive maintenance for freight trucks, container ships, rail logistics, and air cargo ▶Integration of AI, IoT, and robotics in autonomous vehicle navigation, smart cargo handling, and real- time fmeet analytics ▶CRM and digital platforms for freight scheduling, real-time tracking, and automated invoicing Optimized fuel consumption, emission reduction, and energy- efgicient logistics infrastructure Enablement and Implementation ▶Post-merger integration for freight carriers, supply chain tech fjrms, and third-party logistics (3PL) providers ▶Execution and quality control in freight operations, warehouse automation, and cargo safety solutions ▶Supply chain and logistics optimization for real-time cargo tracking, automated load planning, and warehouse efgiciency COPYRIGHT KEN RESEARCH. ALL RIGHTS RESERVED
Ken Offerings Our Solutions to Help Increase Stakeholder Value Category Operational Efficiency Cost Management Key Focus Areas with Embedded KPIs - Increase on-time delivery rate through route optimization - Reduce cost per mile through optimized load planning ➤ ➤ ➤ - Improve fuel efficiency with modern vehicles - Lower maintenance costs with proactive servicing ➤ ➤ - Enhance vehicle uptime via predictive maintenance - Improve fuel cost management with energy-efficient practices ➤ ➤ Customer Experience & Satisfaction Fleet Management Market Expansion & Share Growth - Optimize fleet utilization rate through load optimization ➤ - Increase customer satisfaction (CSAT, NPS) with timely deliveries - Expand market share % in emerging regions through strategic routes ➤ ➤ - Improve fleet turnover rate for better operational efficiency ➤ - Improve lead time accuracy with real-time tracking systems ➤ - Increase freight volume with customer diversification ➤ - Increase maintenance adherence rate with scheduled upkeep ➤ - Enhance delivery reliability with better communication tools ➤ - Enhance capacity utilization rate for optimal load carrying ➤ Sustainability & Compliance Technology & Innovation Risk Management & Safety - Reduce carbon emissions through eco-friendly fleet - Increase technology adoption rate through IoT and GPS tracking - Reduce accident rate and improve driver safety ➤ ➤ ➤ - Achieve compliance with regulations (DOT, local laws) - Enhance route optimization algorithm performance - Improve insurance claim ratio through risk mitigation strategies ➤ ➤ ➤ - Maintain sustainability metrics through green logistics - Improve real-time data accuracy for better decision making - Enhance compliance adherence with safety protocols ➤ ➤ ➤ COPYRIGHT KEN RESEARCH. ALL RIGHTS RESERVED
▶Ken Research brings you industry-leading brand valuation, combined with research from the world’s THOUGHT LEADERSHIP PATHWAYS TO EXCEPTIONAL GROWTH This report is just the beginning. Connect with Ken Research experts, who track macroeconomic trends impacting global brands. Our library of over 20,000 reports spans key markets like China, France, and the US, ofgering deep insights at kenresearch.com. With over 200 experts and insights from 80+ countries, Ken Research provides the knowledge you need. Our comprehensive approach combines innovative methodologies, consumer insights, creative content, and strategic media investments, optimizing your market presence and driving growth. We are available to personally discuss how we can support you and your brand’s success. Feel free to contact me Sincerely, Ankur Gupta Namit Goel Partner & Founder Partner & Founder ankur@kenresearch.com namit@kenresearch.com COPYRIGHT KEN RESEARCH. ALL RIGHTS RESERVED
Research Methodology 1. Desk Research Sources 2. Expert Interviews 3. Sanity Check Models 4. Forecasting Modeling Conducted interviews with industry experts and key stakeholders to gain insights into market dynamics, challenges, and opportunities in the UAE Automotive Aftermarket. Utilized industry reports, government publications, and market databases to gather data on the UAE Automotive Aftermarket, including market trends, key players, and consumer behavior. Applied a proxy model using the number of vehicles, frequency of maintenance, and average spend per service to estimate the addressable market size, cross-verified with supply- side data on player revenues. Developed future market forecasts using time-series analysis and regression models, incorporating economic indicators and industry growth drivers specific to the UAE Automotive Aftermarket. SAMPLE SIZE BY STAKEHOLDERS By Stakeholders Number of Respondents C Level Executive ~ Respondents Operational/Regional Managers ~ Respondents Business Development / Sales Manager ~ Respondents Others -Key opinion leaders from Associations, Warehouses, and Manufacturing firms. SAMPLE SIZE BY RESPONDENT CATEGORY IN PERCENTAGE (%) C Level Executive - XX% Operational/Regional Managers - XX% Business Development / Sales Manager - XX% Others - XX% COPYRIGHT KEN RESEARCH. ALL RIGHTS RESERVED
CATEGORIES AGRICULTURE AND ANIMAL CARE AUTOMOTIVE, TRANSPORTATION AND WAREHOUSING BANKING FINANCIAL SERVICES AND INSURANCE ▶ Agriculture Equipment ▶ Animal Care ▶ Crop Protection ▶ Farming ▶ Seed ▶ Automotive and Automotive Components ▶ General Transportation ▶ Logistics and Shipping ▶ Banking ▶ Financial Services ▶ Insurance ▶ Loans and Advances See More > See More > See More > PUBLIC SECTOR AND ADMINISTRATION ENERGY AND UTILITIES HEALTHCARE ▶ Legal Services ▶ Public Services ▶ Religion ▶ Clean Technology ▶ Gas ▶ Oil ▶ Power ▶ Diagnostics ▶ General Healthcare ▶ Medical Devices ▶ Pharmaceuticals See More > See More > See More > DEFENSE AND SECURITY METAL, MINING AND CHEMICALS Technology AND TELECOM ▶ Defense ▶ Security Devices ▶ Weapon ▶ Chemicals ▶ Metals & Minerals ▶ Mining ▶ IT and ITES ▶ Telecommunications and Networking See More > See More > See More > COPYRIGHT KEN RESEARCH. ALL RIGHTS RESERVED
CATEGORIES EDUCATION AND RECRUITMENT FOOD, BEVERAGE AND TOBACCO MEDIA AND ENTERTAINMENT ▶ Education ▶ Recruitment ▶ Alcoholic Beverages ▶ Dairy Products ▶ Food Services ▶ General Food ▶ Non Alcoholic Beverages ▶ Tobacco Products ▶ Advertising ▶ Films and Animation ▶ Gaming and Gambling Information Services, Newspaper and Magazines ▶ Tourism ▶ TV, Radio and Broadcasting ▶ See More > See More > See More > MANUFACTURING AND CONSTRUCTION CONSUMER PRODUCTS AND RETAIL MARKET ▶ Construction Materials ▶ Industrial Engineering ▶ Infrastructure ▶ Machinery and Parts ▶ Other Manufacturing Activities ▶ Real Estate ▶ Baby Care ▶ Consumer Electronics ▶ Consumer Services ▶ Cosmetics and Personal Care ▶ Home and Ofgice Furnishings ▶ Luxury Goods ▶ Sports Equipment ▶ Textile, Apparel and Footwear ▶ Wholesale and Retail See More > See More > COPYRIGHT KEN RESEARCH. ALL RIGHTS RESERVED
CONTACT US With 13 years of experience, we’ve served over 2,000 clients, including 70% of Fortune 500 companies, delivering 20,000+ reports across 340+ industries. We're here to help you fjnd the right market insights and strategies. Our team is ready to support your needs and help your business grow. For further information, please contact: ANKUR GUPTA Partner & Founder NAMIT GOEL Partner & Founder ankur@kenresearch.com namit@kenresearch.com +91 9311149880 +91 9311149880 INDIA (IN) INDONESIA (ID) Unit 14, Tower B3, Spaze i Tech# Business Park, Sohna Road, sector 49 Gurgaon, Haryana - 122001, India The Icon BSD City, Jl. Verdant View IIIA No.15, Tangera Regency, Province Banten-15345, Indonesia UNITED ARAB EMIRATES (UAE) QATAR 105, Al Jaz1, Street no 2 the Greens Dubai United Art Emirates. Ofgice no. 9, Building no. 171, Zone no. 42, Street no. 230, Al-Rehab Complex, C-Ring road Doha, Qatar - PO Box no. 30867