Download
1 / 39
400 likes | 642 Views
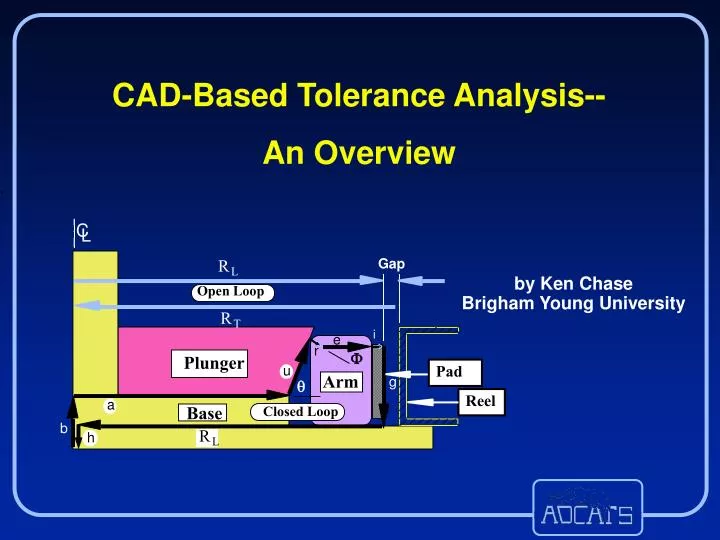
C. L. R. L. R. T. Arm. R. L. h. a. u. CAD-Based Tolerance Analysis-- An Overview. Gap. by Ken Chase Brigham Young University. Open Loop. i. e. r. . Plunger. Pad. g. . Reel. Base. Closed Loop. b. Concurrent Engineering. Product Release. Product Release. Cost or

E N D
C L R L R T Arm R L h a u CAD-Based Tolerance Analysis-- An Overview Gap by Ken Chase Brigham Young University Open Loop i e r Plunger Pad g Reel Base Closed Loop b
Concurrent Engineering Product Release Product Release Cost or Effort Development Time When manufacturing considerations are included early in the design process, product development time may be significantly shortened
Critical Link Engineering Design Manufacture Engineering Tolerances Tolerance analysis is the link between design & manufacturing
Effects of Tolerances are Far-reaching Engineering Manufacturing Design Resultant Dimensions Fit and Function Design Limits Performance Sensitivity Design Intent Robust to Variation Customer Satisfaction Production Cost Process Selection Machine Tools Operator Skills Tooling, Fixtures Inspection Precision Assemblability Scrap and Rework
Tolerance Analysis Given Find Component Tolerances Assembly Tolerance LL UL Assembly Function Acceptance Fraction
Tolerance Analysis PromotesConcurrent Engineering Assembly Tolerance Analysis Assembly Tolerances Component Tolerances Performance Requirements Engineering Model Production Requirements Improved Performance Decreased Cost
3 Sources of Variation in Assemblies R +∆R A+∆A R R A A U U U +∆U Geometric Dimensional and Kinematic
CATS Modeler Mfg CAD Process Database Database The CATS System 3-D CAD System CATS Application Interface CATS Analyzer
1986 CADAM 1-D graphical modeler 1987 GE Calma 1-D graphical modeler 1988 HP ME-10 2-D vector modeler 1989 Alpha 1 3-D solid modeler X Windows CATS interface 1990 AutoCAD 2-D modeler: AutoCATS 1991 Auto loop generation 1992 CATIA & Computervision 3-D modelers 1993 Assembly tolerance requirements models 1995 Pro/E 3-D parametric modeler Automatic joint recognition 2000 Variation modeling on ADAMS CATS Modeler Milestones
C L R L R T Arm Base Closed Loop h R u L a Vector Assembly Model Gap Open Loop i e r Plunger Pad g Reel b
3-D Kinematic Joints Parallel Cylinders (2) Rigid (no motion) Prismatic (1) Revolute (1) Cylindrical (2) Spherical (3) Planar (3) Edge Slider (4) Crossed Cylinders (5) Cylindrical Slider (4) Point Slider (5) Spherical Slider (5)
Vector Path Through a Joint U2 Datum 1 Datum 2 U Datum 2 U1 Datum 1 2-D Joint 3-D Joint
Vector Path Across a Part DRF R A DRF U Passes through the DRF
Translational Variation 2-D Propagation of Surface Variation Rotational Variation Tolerance Nominal Zone Circle Tolerance Zone Tolerance Zone Block on a plane Cylinder on a plane
3-D Propagation of Surface Variation K Kinematic Motion F Geometric Feature Variation F F K K y y y K K x x F z z F K F K K Cylindrical Slider Joint Planar Joint
-A- Assembly Tolerance Specifications DESIGN SPECIFICATIONS Component Tolerances Assembly Tolerances Parallelism Parallelism A A Part B Part B Part C -A-
-A- A A - A - DESIGN SPECIFICATIONS Assembly Tolerances Component Tolerances Perpendicularity & Angularity Perpendicularity & Angularity A A A q± d q -A- Concentricity & Runout Concentricity & Runout A A -A-
CATS Assembly Modeler Status • Modeling Task Graphical Automation Level • Interface • 1. Specify datums √ All graphical • 2. Specify assembly specs √ All graphical • 3. Select and locate √ All graphical • assembly joints • 4. Define datum paths √ All graphical • 5. Define closed vector loop √ Auto loop generation • 6. Define open vector loops √ Auto loop generation • 7. Specify geometric √ Auto DOF check • variations
Predicted rejects Quality level Skewed distributions Statistical algorithms built-in No equations to type CE/TOL Analyzer
1984 1-D stackup with cost optimization 1986 Cost optimization with process selection CATS 1-D Analyzer v1 1987 Estimated Mean Shift Method 1988 CATS 2-D vector loop analysis; 2-D kinematic joints Linearized solution of implicit assembly functions 1989 2-D analysis with GD&T form variation 1990 Mating hole pattern statistical analysis 1991 3-D vector loop analysis; 3-D joints; 3-D GD&T 1993 Analysis of library of assembly tolerance specs 1994 Nonlinear tolerance analysis by MSM 1995 Variation Polygon representation 1996 Yield prediction for multiple assembly tolerance specs 1997 Effect of surface waviness on GD&T form variation 2000 Tolerance analysis on ADAMS CATS Analyzer Milestones
Complex Assembly Functions y = f(x) Explicit Implicit f(x, y) = 0
b x y c a • • 38% 19% 15% 10% 10% 5% CATS determines the % contribution by each component tolerance to overall assembly variation
Component Tolerances Tolerance Allocation Given Find Assembly Tolerance LL UL Allocation Scheme Acceptance Fraction
Accuracy / Efficiency 3 part assembly, 6 dimensions, 9 equations
CATS Tolerance Analysis Status • Analysis Task Graphical Automation Level • Interface • 1. Generate assembly Automatic • equations and sensitivities. • 2. Set up matrices and solve Automatic • 3. Calculate assembly variation √ Built-in • and percent rejects • 4. Calculate and plot sensitivities √ Built-in • and percent contribution • 5. Plot assembly distribution √ Automatic • 6. Perform tolerance synthesis √ Built-in algorithms • 7. Perform design iteration √ Interactive graphical • interface
Add dimensional variations to a kinematic model Modify the input and output variables Extract the tolerance sensitvities from a velocity analysis Converts a kinematic analysis to a tolerance analysis Even works for static assemblies (no moving parts) Equivalent Variational Mechanisms
Tolerance Analysis of Compliant Assemblies Simple lap joint of two thin plates
y y z z x x Twisted Gap Uniform X Gap y y Rotated Interference / gap z z x x Uniform Y Gap Multiple Cases - Single FEA Model
1996 Statistical FEA for compliant assemblies Material covariance due to elastic coupling 1998 Geometric covariance - surface continuity Geometric covariance from Bezier curves 1999 Geometric covariance by spectral analysis Wavelength effects on assembly variation Spectral characterization of surface variation 2000 Geometric covariance by polynomial analysis Compliant Assembly Milestones
Statistical FEA Solution FEA Solution: Closure Force Statistical FEA Solution: Mean Closure Force Closure Force Cov where: Equivalent Stiffness
Dr. Ken Chase Brigham Young University 435 CTB Provo, Utah 84602 Tel: (801) 378-6541 FAX: (801) 378-5037 email: chasek@byu.edu website: adcats.et.byu.edu Association for the Development of Computer-Aided Tolerancing Systems
Tolerance Analysis of Compliant Assemblies Airplane skin panels Automotive body panels
Displacing one node affects the displacement of surrounding nodes Described by the stiffness matrix of the part Material Covariance
Nodal variations are not independently random Part surfaces are continuous Random surfaces must be used to include covariance effects in statistical analyses Geometric Covariance
Covariance from Spectral Analysis Frequency spectrum 2 Auto- spectrum IFFT Auto- correlation
Large sample size required for accuracy 5,000 FE solutions Slower Comparison of Results Standard deviation of closure force MonteCarlo FASTA • Very similar results • Smaller sample size • required for accuracy • 2 FE solutions