Download
1 / 18
180 likes | 314 Views
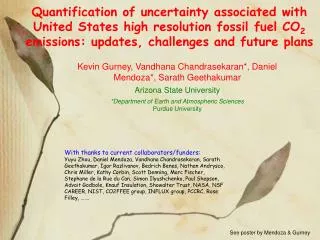
Quantification of uncertainty associated with United States high resolution fossil fuel CO 2 emissions: updates, challenges and future plans. Kevin Gurney, Vandhana Chandrasekaran*, Daniel Mendoza*, Sarath Geethakumar Arizona State University

E N D
Quantification of uncertainty associated with United States high resolution fossil fuel CO2 emissions: updates, challenges and future plans Kevin Gurney, Vandhana Chandrasekaran*, Daniel Mendoza*, Sarath Geethakumar Arizona State University *Department of Earth and Atmospheric SciencesPurdue University With thanks to current collaborators/funders: Yuyu Zhou, Daniel Mendoza, Vandhana Chandrasekaran, Sarath Geethakumar, Igor Razlivanov, Bedrich Benes, Nathan Andrysco, Chris Miller, Kathy Corbin, Scott Denning, Marc Fischer, Stephane de la Rue du Can, Simon Ilyushchenko, Paul Shepson, Advait Godbole, Knauf Insulation, Showalter Trust, NASA, NSF CAREER, NIST, CO2FFEE group, INFLUX group, PCCRC, Rose Filley, ……. See poster by Mendoza & Gurney
Version 2.0 now available (please use latest documentation) Vulcan www.purdue.edu/eas/carbon/vulcan Gurney et al., Env. Sci & Tech, 2009
Multiple datastreams transformed to CO2 Vulcan is a “data product” – it uses mostly “regulatory data”
Estimation process 3 fundamental processes CO2 direct (95% of electricity production emit) Bias and uncertainty on CEMs! CO to fuel to CO2 (Res, Comm, Ind, airport) (g is CO, f is fuel, n is process) VMT/fuel efficiency to CO2 (onroad, nonroad)
Uncertainty – our approach In the form of “sensitivity” – hi and lo SD CO emission factor range from databases reported CO2 (power plants: Ackerman & Sundquist, 2008)* carbon content by fuel from DOE data heat content by fuel from DOE data VMT uncertainty from FHWA Fleet age distribution variation from sample data Clinker production & EF Not considered Not yet incorporated reported fuel type reported timeframe reported device omission errors reported CO emission value* Vehicular fuel efficiency (SE & SD) Nonroad uncertainties (3%) No spatial (impact to area sources, transportation) No temporal (impact res, comm, ind)
National-level 2002 Vulcan / DOE comparison (MtC/year) DOE/EIA -- “Emissions of Greenhouse Gases in the United States” [2009]. • Data sources are ~90% independent • Fugitive and bunker represent ~3% • Vulcan greater than DOE/EIA in onroad primarily
Context for this level of uncertainty 10% uncertainty is ~160 MtC/year (0.16 GtC/yr) 1.8 X proposed 7% Kyoto target for the US 1.5 X 2007 Australia fossil fuel CO2 emissions ~entire bottom-up estimated US forest sink ~entire 2007 UK fossil fuel CO2 emissions
What sectors, error sources dominate? Sectors Error sources
Evaluation THE TOP TEN (19% of ERROR!) • Cuyahoga, OH (Cleveland)……... ±50% • Harris, TX (Houston) ……………. ±35% • Porter, IN (steel industry)……….. ±40% • Los Angeles, CA (LA)……………. ±15% • Hennepin, MN (Minneapolis) • Hutchinson, TX (oil/gas industry) • Monterey, CA • Cook, IL (Chicago) • San Diego, CA (commercial) • Wayne, MI (Detroit) Indianapolis (INFLUX/Hestia fame) is 87th
Challenges & next steps: • Still not a complete uncertainty assessment • Incoming CO emissions uncertainty • Variations in fuel efficiency (estimate of the mean; driving patterns, start/stop, etc) • Powerplant by powerplant examination (CEMs v fuel stats) • Spatial analysis of uncertainty (at 10 km scale) • Monte Carlo approach
Conclusions: • Central estimate is consistent with DOE fuel (within 2%) • National-level uncertainty: ~10%. Average county uncertainty: ~ ±8% (will likely increase) • Driven by VMT uncertainty, Industrial CO EF & CO2 EF, Electricity Production fuel stat/CEMs uncertainty • County distribution of error is highly lognormal • ~20% of uncertainty in 10 counties (cities and large industrial concentrations), 50% in top 5% of counties • How can we really progress? • Measure atmosphere – of course • Improve the measurements of fuel, driving, CEMs Concrete suggestion: bring science to 5% of large powerplants and industrial point sources!!
Thank you Thank You!
Hestia flythrough……. Click here for link to movie (135 M) Thanks to Bedrich Benes & Yuyu Zhou