Download

1 / 86
920 likes | 1.16k Views
Electrical Power Interruption Cost Estimates for. Individual Industries, Sectors, and U.S. Economy. Adopted from The Original for Educational Purpose Sudaryatno Sudirham. Electrical Power Interruption Cost Estimates for Individual Industries, Sectors, and U.S. Economy. P. J. Balducci

E N D
Electrical Power Interruption Cost Estimates for Individual Industries, Sectors, and U.S. Economy Adopted from The Original for Educational Purpose Sudaryatno Sudirham
Electrical Power Interruption Cost Estimates for Individual Industries, Sectors, and U.S. Economy P. J. Balducci J. M. Roop L. A. Schienbein J. G. DeSteese M. R. Weimar February 2002 Prepared for the U.S. Department of Energy Office of Power Technologies Office of Distributed Resources under Contract DE-AC06-76RL01830 Pacific Northwest National Laboratory Richland, Washington 99352
Summary Electrical power systems play a central and key role in the production of goods and services in both the commercial and industrial sectors, and directly and significantly affect the lives of private citizens. The U.S. bulk power grid has an average availability of about 99.96 percent Although 99.96 percent represents a very high reliability (about 3.5 hours of downtime per year), even a moment’s disruption can have devastating effects on power sensitive customers such as internet service providers, data centers, wireless telecommunication networks, on-line traders, computer chip manufacturers and medical research centers For these customers, power disruptions can result in data corruption, burned circuit boards,component damage, file corruption and lost customers
While distributed energy resources (DER) are being heavily promoted as the least-cost approach to meeting steadily increasing demand, a critical question remains: Can DER deployment also maintain orimprove the electric power supply reliability and power quality currently available to consumers? This report addresses two key factors that must be analyzed and understood to help answer this question: • characteristics of existing power supply reliability, and • costs resulting from supply interruptions (or outages) characteristic of the power grid, as it exists today These costs, incurred mostly by powerconsumers, and their distribution amongst the various industrial, commercial, transportation andresidential sectors, must be completely understood because they are a principal driver for the commercialdeployment of DER systems already taking place
This report focuses on one element within the analysis of the benefits and costs associated with improved system reliability – interruption costs These costs can take both direct and indirect forms Direct costs include lost production, idle facilities and labor, damage to electronic data, damaged or spoiled product, damage to equipment or customer refunds. Residential customers may experience direct out-of-pocket expense (e.g., the purchase of wood for home heating, alternative light sources, food spoilage or damage to electrical equipment) as a result of power interruption. Indirect costs (e.g., accidental injuries, looting, vandalism, legal costs, loss of water supply, increases in insurance rates) with monetary impacts that, in some cases, may exceed direct costs.
Although limited by constraints in the data used, the analysis presented in this report indicate that an interruption in power supply can result in considerable costs to end-users in the industrial, commercial and transportation sectors. The findings of this and other studies of interruption costs conclude that outage costs vary significantly based on the demand characteristics of the end-user. Interruption costs appear to be highest in the transportation sector at $16.42/kW for a 1-hour interruption, followed by the industrial sector ($13.93/kW) and the commercial sector ($12.87/kW). Residential customers incur costs ($0.15/kW for a 1-hour interruption) that are a fraction of those incurred by end-users in the other sectors.
While the costs associated with improved system reliability through investment in new facilities and equipment are well documented, the benefits that accrue to the U.S. economy as a result of improved system reliability are more difficult to quantify with precision. However, the findings of this and other cited studies indicate that the societal worth of electric power system reliability is significant.
During the last 20 years, utilities and researchers have begun to understand the value in the collection and analysis of interruption cost data. The continued investigation of the monetary impact of power outages will facilitate advancement of the analytical methods used to measure costs and benefits from the perspective of the energy consumer. More in-depth analysis may be warranted to consider the effects of privatization and deregulation of power utilities, price instability in certain regions of the U.S., and the continued evolution of alternative auxiliary power systems. Further research would be needed to address the costs associated with power quality events such as power surges, spikes, sags, line noise, frequency variation, switching transients and brownouts.
1.0 Introduction This report is an account of work conducted by Pacific Northwest National Laboratory (PNNL) for the U.S. Department of Energy (DOE) Office of Power Technologies (OPT) as part of a project to assess the power quality and power reliability implications of distributed energy resources (DER). This task report focuses on one element, interruption costs, within the analysis of the benefits and costs associated with improved systems reliability.
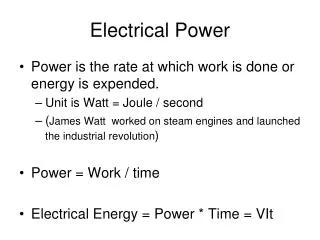
1.0 Introduction Electrical power systems play a central and key role in the production of goods and services in both the commercial and industrial sectors, and directly and significantly affect the lives of private citizens. In thisera of increasing demand for energy (Figure 1), growing competition within the electric utility industry, and volatile electricity prices, it has become evident that continued growth of the U.S. economy could depend, in large part, on the reliability and sustainability of the nation’s energy supply system.
1.0 Introduction The demand for electricity is forecast to increase significantly during the next 20 years. Domestic demand for electricity is expected to increase by more than 1 trillion kilowatt-hours by 2020. During the same time frame, growth in demand for electricity outside the United States is forecast to increase by almost 9 trillion kilowatt-hours (1999). Growing demand for electricity could strain the capacity of the existing electrical power grid.
1.0 Introduction Distributed energy resources operating both as part of the grid and in the off-grid mode may offer a means to meet the demand growth, while maintaining and even improving grid reliability and power quality. While DER is being heavily promoted as the least cost approach to meeting the steadily increasing demand, a critical question remains. That is, can DER deployment also maintain the electric power supply reliability and power quality currently available to the customers? This report addresses two key factor that must be analyzed and understood to help answer this question – the characteristics of existing power supply reliability the costs resulting from the supply interruptions (or outages) characteristic of the power grid, as it exists today.
1.0 Introduction These costs, incurred mostly by the power customers, and their distribution among the various industrial, commercial, transportation and residential sectors must be completely understood. They are principal drivers for the commercial deployment of DER systems already taking place (e.g., uninterruptible power supplies (UPS)) and a major factor in determining the nature and form (i.e., architecture) of DER deployment and operation in the future electrical power grid system.
1.0 Introduction The U.S. bulk power grid operates appliances, lights and electric motors at an availability of about 99.96 percent. This is generally referred to as approaching “4 nines” of reliability. In terms of power outages, “4 nines” of reliability corresponds to approximately 1 hour of downtime per year. Although 99.96 percent represents a very high reliability (about 3.5 hours of downtime per year), even a moment’s disruption can have devastating effects on power sensitive customers such as internet service providers, data centers, wireless telecommunication networks, on-line traders, computer chip manufacturers and medical research centers. For these customers, power disruptions can result in data corruption, burned circuit boards, component damage, file corruption and lost customers.
1.0 Introduction New high-tech firms operating in the digital economy require premium power with limited interruption. However, the cost of adding “nines” to the rate of reliability is exponential rather than linear. For example, utilities sell electricity with at least “3 nines” of reliability at a retail price of $0.06 to $0.12/kWh, with prices varying based on geographic location and other factors. To achieve “6 nines” of reliability (downtime reduced from 8.75 hours to 30 seconds annually), a consumer might use a fuel cell, UPS, diesel generator or flywheel to generate a nearly uninterrupted supply of electricity. The cost of these additional approximately 8.74 hours of power supply integrity can be as much as $1,000 per kWh delivered (Stephens, Inc., 2000). Nevertheless, power sensitive consumers with millions to lose in the event of a power outage often view an expenditure on UPS systems as a prudent investment.
1.0 Introduction The costs associated with improved system reliability through investment in new facilities and equipment are well documented. The benefits that accrue to the U.S. economy as a result of improved system reliability, however, are much more difficult to quantify and assign to individual industries or customers. Thus, power system planners and industrial and commercial customers are now faced with the difficult task of finding the optimum balance between the costs associated with investment in energy infrastructure and the benefits realized through improved system reliability.
1.0 Introduction Further research would be needed to address the costs associated with sub-optimal power quality events such as power surges, spikes, sags, line noise, frequency variation, switching transients or brownouts. While it is not technically nor economically feasible to produce a 100-percent reliable electrical energy supply system, it is important to note that an interruption in power supply can result in enormous costs to industrial and commercial users. These costs can take both direct and indirect forms. Direct costs include lost production, idle facilities and labor, damage to electronic data, damaged or spoiled product, damage to equipment or customer refunds. Residential customers may experience direct out-of-pocket expense (e.g., the purchase of wood for home heating, alternative light sources, food spoilage or damage to electrical equipment) as a result of power interruption.
1.0 Introduction In addition to direct costs, there are several types of indirect costs (e.g., accidental injuries, looting, vandalism, legal costs, loss of water supply, increases in insurance rates) with monetary impacts that, in some cases, may exceed direct costs. In fact, an analysis of the interruption costs incurred as a result of the 1977 New York City blackout estimated that the indirect costs of the blackout exceeded direct costs by a margin of 5 to 1 (Table 1). To date, studies of power outages have produced wide-ranging estimates of end-user interruption costs. Alhough the estimates have not always been consistent, one fact is clearly supported by virtually all the data presented in this and other studies – outage costs vary significantly based on the demand characteristics of the end-user.
1.0 Introduction Numerous studies have attempted to estimate the costs associated with power interruptions. Table 2 provides summary information for several interruption cost studies. In Table 2, studies are listed with the geographic area studied, year of publication and findings. Billinton used survey data collected in Saskatchewan, Canada in 1982, 1992 and 1996 to produce interruption cost estimates for the industrial, commercial and residential sectors. Billinton found that interruption costs for the industrial sector grew slightly between 1982 and 1996, while the costs for the commercial sector grew sharply during the same time period. There have been a small group of studies conducted in North America, yielding a wide range of interruption cost estimates – from US $0.60/kWh to Canadian (C) $91/kW for a 1-hour interruption. Generally, residential customers experience the lowest interruption costs, while commercial customers experience the highest costs, even after normalizing the data.
1.0 Introduction In 1995, a study conducted by the Electric Power Research Institute (EPRI) found that power outages and other power quality disturbances cost the U.S. economy approximately $30 billion annually. In 2001, EPRI revised their estimate upward to $119 billion annually, representing an increase of almost 300 percent over the previous estimate. Note that the EPRI studies include both power outage and power quality disturbance costs, whereas all the other studies referenced in Table 2 identify only interruption costs. This report is divided into five sections with the first being this introduction. The second section provides an overview of the study methodology and data. The third section presents study findings. The fourth section analyzes study shortcomings. The fifth, and final, section presents study conclusions. All interruption cost estimates prepared for this report are presented in terms of 1996 US$.
2.0 Methodology and Data When analyzing interruption costs, the goal is to identify outage costs incurred by end-users of electricity within a wide range of industries for varying durations of time. Unfortunately, the analysis of interruption costs is difficult as a result of the lack of available data and the imprecision evident in most data sets. To overcome the data barrier, several methods have been developed to identify interruption costs by industry. The three most common methods are:
2.0 Methodology and Data 1. Customer Survey: This method uses surveys of industrial, commercial and residential sector customers to determine the cost of an interruption from the perspective of the individual customer. Surveys generally request interruption cost estimates for varying durations of time (e.g., 10 minutes, 30 minutes, 1 hour, 4 hours). The customer surveys are designed to obtain a statistically significant sample from several different industries. By aggregating and normalizing the data, the surveyor is then able to establish interruption cost estimates by industry and sector. When properly designed and executed, this approach can generate reliable cost estimates based on data provided directly by end users. The primary problem with this method is the time and high cost associated with survey design and distribution, as well as the collection and analysis of respondent data.
2.0 Methodology and Data 2. Blackout Case Study: The basis of this method is the after-the-fact analysis of specific interruptions. This approach has been limited to blackouts of large metropolitan population centers such as New York City. The 1977 New York City blackout has been studied more extensively than any other outage. The blackout case study method provides more detailed and direct cost estimates that include indirect costs not adequately captured in other forms of analysis. However, the study findings are limited as a result of geographic constraints and the characteristics and duration of the specific outage being studied.
2.0 Methodology and Data 3. Ratio of Gross Economic Output to Energy Consumption: This method uses the ratio of a gross economic measure (e.g., gross output, gross domestic product {GDP}) and a measure of electricity consumption (e.g., peak kW load or kWh) to estimate interruption costs by industry. Based on this method, if an industry consumes 100 million kWh of electricity to produce $1 billion in output, each kWh of electricity is tied to $10 in productivity. Thus, the cost of an outage would be estimated as $10/kWh in lost productivity. This method uses readily available data to perform a straightforward analysis for any industry for which electricity consumption data exist. The disadvantage of this approach is that it is based on severely limiting assumptions that are often invalid, it does not capture many direct costs, and it ignores virtually all indirect costs.
2.0 Methodology and Data Despite inherent limitations, this study uses survey data collected from Canadian energy consumers by the University of Saskatchewan in 1992 and 1996. The 1992 survey captured data from the residential, industrial and a majority of the industries in the commercial sector. The 1996 survey obtained data from the government, banking, insurance, real estate, health and other service industries. The University of Saskatchewan data were used to establish interruption cost functions for individual customers. The interruption cost incurred by a consumer of electricity is presented as a function of outage duration (e.g., 20 minutes, 1 hour and 4 hours). The interruption cost estimate represented as a function of outage duration is a customer damage function (CDF).
2.0 Methodology and Data Cost parameters must be established to normalize interruption cost data and aggregate data into standard industrial classification (SIC) group customer damage functions (GCDF). The most common cost parameters are: the cost of the interruption divided by the annual peak load or maximum demand in kW ($/kW), the dollar cost of the interruption in terms of unsupplied energy in kWh ($/kWh) and cost per interruption ($/interruption).
2.0 Methodology and Data The University of Saskatchewan data were normalized using the $/kW parameter. To illustrate how this parameter works, consider the following case study. A pipe-rolling factory suffers a 1-hour power interruption. As a result of the 1-hour interruption, materials used in the manufacturing process must be cleared from the rolling, welding and polishing machinery. The machines that process the raw materials must be reset so that the process can restart once the power resumes. Additional costs are incurred as the result of lost production and idle labor. In this case, the 1-hour interruption costs the owner of the pipe rolling factory $46,000 as a result of lost productivity and labor costs. Assuming that the annual peak load for the pipe-rolling factory is 10,000 kW, the normalized cost of the 1-hour interruption would be $4.60/kW.
2.0 Methodology and Data The University of Saskatchewan study established GCDFs for groups of customers based on Canadian SIC codes. For this analysis, the Canadian GCDFs were placed into corresponding U.S. SIC groups. The University of Saskatchewan survey reached most manufacturing, agriculture, government, mining and retail SIC groups. Data from transportation, service and construction SIC groups, however, are generally missing or incomplete. To fill data gaps, peer groups were established based on business operations and demand characteristics. Representative industry data were then used as a proxy for interruption costs within groups with missing data.
2.0 Methodology and Data Cost estimates presented in the University of Saskatchewan study were presented in terms of Canadian dollars. The cost estimates produced in 1992 were converted to U.S. dollars based on 1992 Canadian-U.S. exchange rates. The 1996 data were converted to U.S. dollars based on 1996 exchange rates. Further, data presented in terms of 1992 dollars were inflated to 1996 dollars based on the GDP Implicit Price Deflator.
2.0 Methodology and Data The interruption cost estimates for all SIC groups were used to construct industry customer damage functions (ICDFs). ICDFs were generated for the agriculture, mining, construction, manufacturing, transportation, commercial, utilities, wholesale, retail and services industries, along with residential and government consumers. Three weighting factors were used to construct ICDFs – relative share of total industry-wide electricity consumption, relative share of industry GDP and relative share of gross output. ICDFs were then used to generate sector customer damage functions (SCDFs) for the industrial and commercial sectors based on relative shares of GDP. No additional weighting was required to produce SCDFs for the transportation and residential sectors. Finally, SCDFs for the industrial, commercial, transportation and residential sectors were weighted based on relative shares of electricity consumption to produce an interruption cost estimate for the entire U.S. economy.
Table 3 presents SCDFs for the industrial, commercial, transportation, and residential sectors. Weighted average interruption costs for the entire U.S. economy are also presented. SCDFs are presented in terms of cost per peak load or maximum demand in $/kW and the interruption duration in hours. SCDFs for a 1-hour interruption range from a low of $0.15/kW in the residential sector to a high of $16.42/kW in the transportation sector. The weighted average cost of a 1-hour interruption for all sectors is $8.76/kW. The SCDF for the industrial sector is relatively high during a short outage, but comparatively low for longer outage durations. The SCDF for the residential sector is a fraction of the SCDFs for all other sectors. Note that interruption costs increase with duration in a non-linear manner.
3.0 Findings, Industrial Sector 3.1 Industrial Sector Industrial operations are highly sensitive to power disruptions. A momentary outage can shut down manufacturing operations for several minutes or hours. Industrial sector customers experience lost production, idle facilities and labor, damage and spoiled product and damaged equipment in the event of a sustained power outage. One case study of a plastic sheet manufacturing plant found that any power outage costs the plant a minimum of $38,000 in lost productivity and labor costs resulting from production set-up time. Further, the case study found that costs rose slowly for 30 minutes until molten feed stock and other ingredients in pipes and pumps began to cool and harden. Hardened ingredients resulted in a day-long cleaning and equipment maintenance operation that created enormous costs to the manufacturer.
3.0 Findings, Industrial Sector To construct an SCDF for the industrial sector, interruption cost data for 32 SIC groups were aggregated and weighted based on relative shares of sector GDP. The industrial sector SCDF for a 20-minute interruption is $6.29/kW, a 1-hour outage equates to a cost of $13.93/kW and a 4-hour interruption costs industrial sector industries an average of $29.94/kW.
3.0 Findings, Industrial Sector The industrial sector is comprised of agriculture, mining, construction and manufacturing industries. Each ICDF shows how a power failure might affect a constituent industry. The monetary impact of an interruption on any industry varies significantly based on the demand characteristics of that industry. Table 4 presents GCDFs for several SIC groups in the industrial sector. As shown, interruption costs are extremely low for agriculture and coal mining operations. The GCDF for the oil and gas extraction industry, however, is extremely high, more than three times higher than any other industry included in the University of Saskatchewan study. Predictably, the GCDF for the food and kindred products industry yields high costs during sustained outages as a result of product spoilage. Individual GCDFs for each SIC group in the industrial sector are shown in Appendix A.
3.0 Findings, Commercial Sector 3.2 Commercial Sector The commercial sector incorporates a wide variety of service industries. Because of the growing reliance on technology and computers, most commercial operations are extremely sensitive to power disruptions. Even short outages to commercial operations have extremely high costs resulting from damage to electronic data and equipment jamming. Long disruptions can result in spoiled product, lost business and customer refunds. A case study of an insurance claim office found that a momentary power interruption resulted in data losses equivalent to 1 hour’s processing. During an interruption, agents are re-directed to other, less productive activities such as filing. The re-assignment of work and resumption of production generally takes approximately 30 minutes. Thus, each power outage results in a loss of 90 minutes of productivity.
3.0 Findings, Commercial Sector Case studies of power sensitive electricity consumers suggest that interruption costs can exceed $1million per hour, as demonstrated in Table 5. Further, Sun Microsystems once estimated interruption costs at up to $1 million per minute. With increased reliance on power-sensitive machines and computer based systems, concerns about power reliability are growing in the U.S. Firms operating in the digital economy require premium, high quality power. In turn, the demand for high reliability has led to an increase in global sales of energy generation equipment, including distributed energy systems such as reciprocating engines, gas turbines, fuel cells wind turbines and photovoltaic cells.
3.0 Findings, Commercial Sector The commercial sector is comprised of 35 SIC groups in the communications, utility, wholesale, retail and service industries. The commercial sector also includes government services. The SCDF for the commercial sector indicates that a 20-minute interruption results in costs equivalent to $4.74/kW, a 1-hour interruption in costs equal to $12.87/kW and a 4-hour interruption costs an average of $44.37/kW. Compared to the industrial sector, interruption costs in the commercial sector are relatively low during short outages, but escalate rapidly during long outages. In fact, the commercial sector SCDF exceeds the industrial sector SCDF by nearly 50 percent during a 4-hour interruption.
3.0 Findings, Commercial Sector Table 5. Interruption Cost for Selected Sensitive Electricity Consumers in the Commercial Sector