Download
1 / 11
110 likes | 205 Views
Tracking violin modes in S2 with LineMonitor for noise investigation. Monitoring harmonic amplitudes with LineMonitor in ADC counts. Thermal noise analysis and comparison with measured data for accuracy improvement. Plans for further analysis of H1 and H2 modes.

E N D
Violin Modes S2 Line Noise Investigation S.Klimenko, F.Raab, M.Diaz, N.Zotov (thanks to Gaby and Andri for discussions) LIGO-G030130-00-Z presented by S. Klimenko Outline Tracking of violin modes in S2 Work in progress Conclusion
Narrow lines are monitored with the LineMonitor Integration time – 1 min we assume that the harmonic’s amplitudes do not change much during the integration time T (line width << 1/T) The LineMonitor estimates an, f andfn Violinfrequencies are known, measure amplitude and phase. Line parameters are constantly measured and stored in trend files Two harmonics for each mode are monitored. Some first harmonics and most of the second harmonics are not visible for 1 min integration time VM Monitoring
Violin Amplitude m A–pendulum vibration amplitude a – mirror motion amplitude (<<A) V – amplitude measured by LineMonitor in ADC counts, converted to a using calibration n – wire-mirror coupling: Thermal noise: quality factor Wire/Mirror motion: M
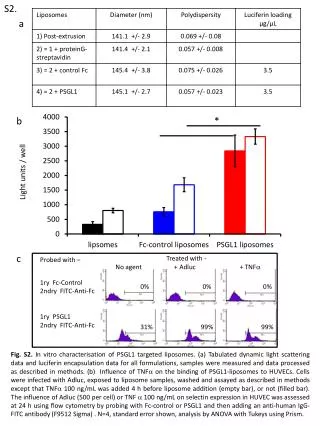
H2 violin modes for S1 run 343.754 39,000 343.814 143,000 ETMX 344.051 70,000 ETMX 344.110 143,000 349.201 116,000 349.245 90,000 349.282 90,000 349.659 175,000 Thermal noise from measured Q’s of H2 violin modes Fred: e-log 9/8/02 The raw data (red circles) is compared to the estimated thermal noise (blue curve)
Calibrated Amplitude R0–response function C0 – sensing function H0– open loop gain (0.376 @ 344 Hz) g,a – t-calibration
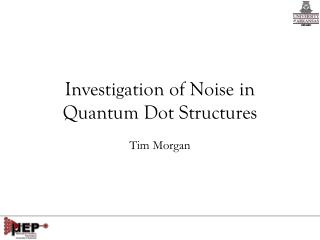
P(a)–Raylegh distribution • P(a2) – exponential • slope s gives <a2> Average square amplitude
non-exponential tail • can be excluded from the fit • LineMon outlier triggers could be used as veto for the analysis. • shifted Rayleigh distribution • slope is not affected by shift external excitation
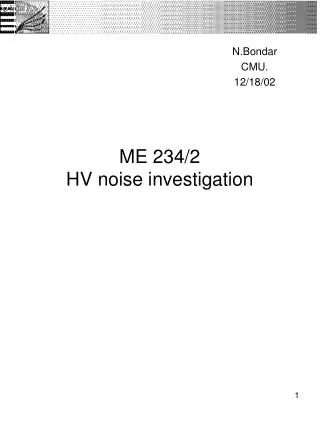
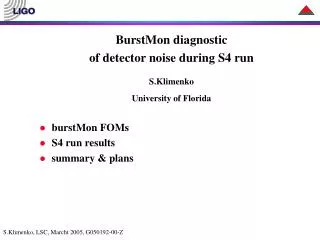
expected noise for simple mechanical model: 15.0-15.5 mf (depends on M and w) L1 Violin thermal noise very preliminary stat. error ~ 1%
Thermal excitation of the violin resonances is observed measured noise: 13-20 mf expected noise: 15.0-15.5 mf more accurate mechanical model should be used for better agreement between measured and calculated noise. the noise measurement could be affected by servo. Plans do analysis of H1 and H2 modes (Sergey) calculate thermal noise from measured Q-factors and compare with the LineMonitor results (Fred) Conclusion & Plans