Download
1 / 33
330 likes | 471 Views
Measurement of disease frequency ( outcome ). BMS 244 , 3 rd , 4 Th lecture Dr Maha Khalid. Epidemiological Outcomes. Ratio: Relationship between two numbers Example: males/females Proportion: A ratio where the numerator is included in the denominator Example: males/total births

E N D
Measurement of disease frequency ( outcome ) BMS 244 , 3rd , 4Th lecture Dr Maha Khalid
Epidemiological Outcomes • Ratio: Relationship between two numbers • Example: males/females • Proportion: A ratio where the numerator is included in the denominator • Example: males/total births • Rate: A proportion with the specification of time • Example: (deaths in 1999/population in 1999) x 1,000
In epidemiology, the occurrence of a disease or condition can be measured using rates and proportions. We use these measures to express the extent of these outcomes in a community or other population. • Rates tell us how fast the disease is occurring in a population. • Proportions tell us what fraction of the population is affected.
Morbidity Measures Number of new events during a time period X 1,000 Incidence Rate = • Incidence is always calculated for a given period of time • An attack rate is an incidence rate calculated for a specific disease for a limited period of time during an epidemic Population at risk
Prevalence = Number of existing events, old and new X 1,000 Population at risk Morbidity Measures • Prevalence is not a rate • Point prevalence measures the frequency of all current events (old and new) at a given instant in time • Period prevalence measures the frequency of all current events (old and new) for a prescribed period of time
High prevalence may reflect: • High risk • Prolonged survival without cure Low prevalence may reflect: • Low risk • Rapid fatal disease progression • Rapid cure Interrelationship: P ID Examples: Ebola, Common cold
RELATIONSHIP BETWEEN INCIDENCE AND PREVALENCE In a STEADY STATE (i.e. if incidence is not changing, and the population is stable) Prevalence rate = incidence rate times the duration of disease (P = I x D)
Cancer of the pancreas Incidence low Duration short Prevalence low Adult onset diabetes Incidence low Duration long Prevalence high Roseola infantum Incidence high Duration short Prevalence low Essential hypertension Incidence high Duration long Prevalence high Relationship Between Incidence and Prevalence (cont.)
PREVALENCE RATE Divided into two types: • Point prevalence rate • Period prevalence rate
POINT PREVALENCE RATE Proportion of individuals in a specified population at risk who have the disease of interest at a given point in time.
PERIOD PREVALENCE RATE Proportion of individuals in a specified population at risk who have the disease of interest over a specified period of time. For example: • annual prevalence rate • lifetime prevalence rate. (When the type of prevalence rate is not specified it is usually point prevalence, or its closest practical approximation)
INCIDENCE RATE Like prevalence, divided into two types: 1. Cumulative incidence rate 2. Incidence density
1. Cumulative incidence rate: Number of new cases of disease occurring over a specified period of time in a population at risk at the beginning of the interval.
EXAMPLE OF CUMULATIVE INCIDENCE RATE If we count all new cases of influenza occurring in MSU undergraduates from September 1, 1997 - August 31, 1998, and we take as the denominator all undergraduates enrolled in September 1, 1997, we would be describing the cumulative incidence rate of influenza.
Example: Cumulative incidence of Sudden Infant Death Syndrome during first year of life Population 1,000 live births Cases of SIDS10 Cumulative Incidence 10/1,000 or 1% over one year • Note that all live births are ‘at risk’
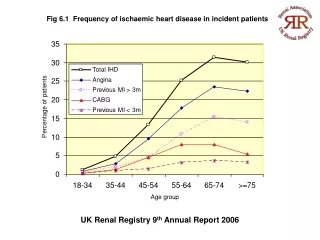
Age and Breast Cancer Risk As shown by these cumulative incidence figures, the biggest single risk factor for breast cancer is age.
2. Incidence density: Number of new cases of disease occurring over a specified period of time in a population at risk throughout the interval.
The numerator does not differ between the two types of incidence • However, the denominator can differ in incidence density from cumulative incidence because it takes account of (in the example): • Students who left school during the year • Students who died • Students who had influenza once and will not have it again the same season • Students who entered school later in the year
Incidence density requires us to add up the period of time each individual was present in the population, and was at risk of becoming a new case of disease. Incidence density characteristically uses as the denominator person-years at risk. (Time period can be person-months, days, or even hours, depending on the disease process being studied.)
The mortality rate is a type of incidence rate which we will discuss in more detail next week. It is the most widely used public health measure, but it has limitations.
ID Example • In the Iowa Women’s Health Study (IWHS), 37,105 women contributed 276,453 person-years of follow-up • Because there were 1,085 incident cases, the rate of breast cancer using the incidence density method is: 1,085/276,453 = 392.5/100,000 person-years
ID Example (cont.) • If each woman had been followed for the entire 8-year period of the study, the total person-years would have been 296,840 and the rate would have been lower (assuming the number of incident cancers was the same) • The incidence density method yielded a higher and more accurate estimate
Uses of Prevalence and Incidence Measures • Prevalence: administration, planning, some research • Incidence: etiologic research (problems with prevalence since it combines IR and D), planning
Calculation Practice Skin Cancer on Sunny Beach: Point prevalence on 9/28/2012 Period prevalence for year 2013 Incidence rate for year 2013 What information will you need?
Diagnosed cases of Skin Cancer on Sunny Beach, 9/28/2012 # of existing cases = 10 Total population at risk = 450 Point Prevalence (9/28/2012) = (10/450)*1000 = 22 per 1000
Diagnosed cases of Skin Cancer on Sunny Beach, 2013 Average population at risk = 500 # of new cases = 5 Incidence rate (year 2013) = (5/500)*1000 = 10 per 1000 Period prevalence (year 2013) = (15/500)*1000 = 30 per 1000
Example Among 60 people attending a 12-month diet control program in city A, 50 test HIV negative at the start of the program in January 1998. At the end of the program in December 1998, 3 of the 50 participants tested positive for HIV. Incidence of HIV among the attendees of the program = 3/50 = 0.06x100 = 6% during this 12-month period.
Example 600 newly-trained police officers enter patrol duties. 33 suffer handgun injury during the first year. Incidence of handgun injury among the police officers= 33/600 = 0.055 x100 = 5.5% during this year.
Example: On 1/7/2000, a survey found 40 case of diabetes (old cases=point prevalence) among 300 tested persons. 20 new cases were detected from 1/7/2000 to 30/6/2001. Prevalence = (40+20) / 300 = 0.2x100 = 20 % during the whole year. So, Period prevalence = Incidence + Point Prevalence
Review of Dimensions Prevalence = people people no dimension Cumulative incidence = people people no dimension Incidence rate = people people-time dimension is time –1
The dynamics of incidence and prevalence New cases Incidence rate Prevalence