Download
1 / 29
300 likes | 414 Views
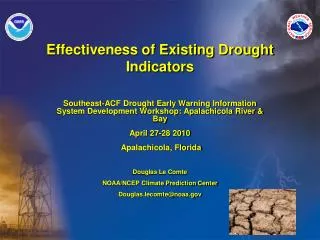
Effectiveness of Existing Drought Indicators. Southeast-ACF Drought Early Warning Information System Development Workshop: Apalachicola River & Bay April 27-28 2010 Apalachicola, Florida Douglas Le Comte NOAA/NCEP Climate Prediction Center Douglas.lecomte@noaa.gov. Outline.

E N D
Effectiveness of Existing Drought Indicators Southeast-ACF Drought Early Warning Information System Development Workshop: Apalachicola River & Bay April 27-28 2010 Apalachicola, Florida Douglas Le Comte NOAA/NCEP Climate Prediction Center Douglas.lecomte@noaa.gov
Outline • A look at selected current drought indicators • An honest appraisal (probably politically incorrect) of how well they work… Doug’s Top 5!
Atlanta Journal Cartoon Lake Lanier drought index—the keep-it-simple approach An effective drought index is one that does what you want it to do. You may want to merge several drought indicators to meet your needs, e.g., CPC delivery of historical river basin indices to the water commissions of GA, FL, AL in January 2001.
Desired Features of a Drought Index • Understandable (what it means and how it’s calculated • Available daily (short term index) or weekly (long-term index) • Correlates with impacts • Range of values easy to understand (e.g., percentiles, anomalies). • Appropriate spatial resolution • Can be imported into GIS (e.g. GeoTIFF) • Has a long history and the archive is easy to find
Historical Perspective* • The Drought Phenomenon • Definition – Sectors Impacted – Indices • Early 20th Century Drought Indices • Incorporated some measure of precipitation over a given time • Examples: • 15 Consecutive Days with No Rain • 21 Days or More with Precipitation less than One-Third (or 30%) of Normal • Annual Precipitation less than 75% of Normal • Monthly Precipitation less than 60% of Normal • Any Amount of Rainfall less than 85% of Normal • Other important climatic elements (soil moisture, evapotranspiration, etc.) were not readily available at that time • * R. Heim (Inter-Regional Workshop on Indices and • Early Warning Systems for Drought WMO/NDMC/NOAA/UNCCD/USDA • Lincoln, NE, USA – December 8-11, 2009)
Historical Perspective • Palmer’s Drought Index (1965) and Crop Moisture Index (1968) • CMI is computed on a weekly basis for agricultural applications • Moisture Stress Index • Developed in 2003 by NCDC • Annual index for corn and soybeans that relates moisture stress (drought and extreme wetness) to crop productivity • Computed from Palmer Z Index and crop yield • Economic impacts
Post-Palmer Era • Indices Based On: • Additional Observed Variables • Advanced Statistical Methodologies • More Sophisticated Models • Data from New Observational Platforms
Standardized Precipitation Index (SPI) • Developed by Colorado’s McKee et al. (1993) • Based on Probability Distribution of Precipitation, with Normalization • Can Compute for Different Time Scales for Differing Applications http://www.ncdc.noaa.gov/oa/climate/research/prelim/drought/spi.html http://www.wrcc.dri.edu/spi/spi.html http://www.agr.gc.ca/pfra/drought/mapscc_e.htm
Soil Moisture • Soil Moisture Observation Networks Limited in U.S. http://www.wcc.nrcs.usda.gov/scan/ http://www.cpc.ncep.noaa.gov/products/monitoring_and_data/topsoil.shtml
Soil Moisture • Rely on Modeled Soil Moisture CPC “Leaky Bucket” Leaky Bucket Model http://www.cpc.noaa.gov/soilmst/leaky_glb.htm http://www.cpc.ncep.noaa.gov/products/Soilmst_Monitoring/US/Soilmst/Soilmst.shtml http://mrcc.sws.uiuc.edu/cliwatch/drought/moisture.htm http://www.agr.gc.ca/pfra/drought/nlslmr_e.htm
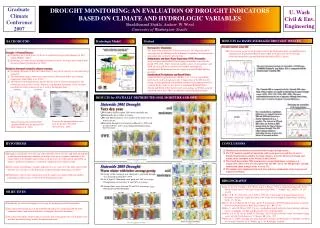
Using the NLDAS Ensemble Mean Soil Moisture as a Drought Indicator Shallow layers of soil moisture can be used as agricultural drought indicators. Model runoff as hydro indicators. http://www.emc.ncep.noaa.gov/mmb/nldas/drought/ Ensemble Mean NCEP Noah NASA Mosaic Princeton VIC OHD SAC Percentile soil moisture levels correspond to U.S. Drought Monitor levels D0 to D4
NOAA/NWS Advanced Hydrologic Prediction Service • Hybrid Product Integrates Radar Precipitation Estimates with In Situ Rain Gage Measurements http://water.weather.gov/index.php
U.S. Objective Blends • Developed as support for U.S. Drought Monitor • Operationally integrate multiple indicators in a weekly update using a percentile ranking method • Produced weekly using CPC’s real-time daily and weekly climate division data and NCDC’s monthly archive of indices for 1932-2000 • All parameters are first rendered as percentiles with respect to 1932-2000 data using a percent rank method • The parameters (drought indicators) are then combined using a weighting scheme • Short- and Long-Term Blends produced
http://www.cpc.ncep.noaa.gov/products/predictions/tools/edb/droughtblend-access-page.htmlhttp://www.cpc.ncep.noaa.gov/products/predictions/tools/edb/droughtblend-access-page.html
Hydrologic Indices • Based on Streamflow or Groundwater • Groundwater Observing Network Coarse http://watermonitor.gov/
Hydrologic Indices • Based on Streamflow or Groundwater • Streamflow – Need to Remove Peak Flow from Hydrograph • Streamflow-based drought indicators usually based on low-flow (base flow) or some averaged flow Flood Monitoring Drought Monitoring Monthly Average Streamflow 14-Day Average Streamflow http://watermonitor.gov/
Hydrologic Indices • Based on Streamflow or Groundwater • Reservoir Data • State data, no national access system • Managed for different purposes (irrigation, urban water supply, flood control, etc.) http://watermonitor.gov/ Arizona reservoir levels, September 2009, percent of capacity.
Remotely-Sensed (Satellite-based) Indices • Provide Global Coverage • Spatially Consistent • Reflected Intensities at Specific Wavelengths http://www.agr.gc.ca/pfra/drought/mapscc_e.htm http://www.star.nesdis.noaa.gov/smcd/emb/vci/VH/index.php
Vegetation Drought Response Index (VegDRI) • Hybrid Drought Index that Integrates: • Satellite-based observations of vegetation conditions • Climate-based drought index data • Biophysical characteristics of the environment http://drought.unl.edu/vegdri/VegDRI_Main.htm (Source: Wardlow, 2008)
No. 5: KBDI http://flame.fl-dof.com/fire_weather/KBDI/4km_main.html Timely: Daily Good short term dryness indicator April 23, 2010: Please Note:Due to technical difficulties the KBDI and Rainfall maps are inaccurate. We apologize for any inconvenience.
No. 4: CPC Drought Indicator Blends http://www.cpc.ncep.noaa.gov/products/predictions/tools/edb/droughtblend-access-page.html Weekly, based on Climate Division data; weights somewhat subjective; not operational
No. 3: Soil Moisture Model (CPC) http://www.cpc.ncep.noaa.gov/products/Soilmst_Monitoring/US/Soilmst/Soilmst.shtml Daily, with 1-day lag, based on CD data; 1.6m depth; good mid-range indicator. Archive available. But, sometimes not realistic (e.g., see extreme drought in upstate NY).
No.2: NLDAS Soil Moisture Promising! And yet… min 5-day lag, sometimes much longer; non-operational; very resource intensive, so computer crashes result in huge delays. http://www.emc.ncep.noaa.gov/mmb/nldas/drought/
No. 1: USGS Streamflow http://waterwatch.usgs.gov/ So much to like! Current, real time, daily to 28-days, reliable, percentile format, zoomable,
A Variety of Format Options Can show in Google Earth as well as Google Maps
Questions? Douglas.lecomte@noaa.gov