Download
1 / 1
10 likes | 104 Views
Explore using Phylogenic Trees and Splitstree Analysis to determine the possible division of A3 subcluster based on terminase, DNA, and protein sequences. Results show distinct groupings of phages indicating the need for further division.

E N D
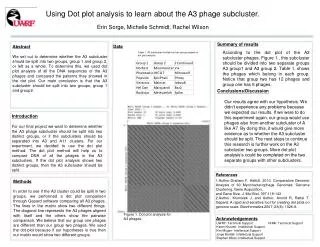
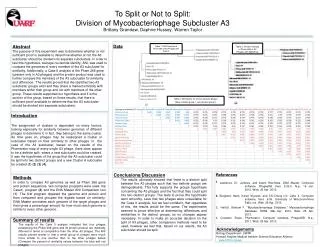
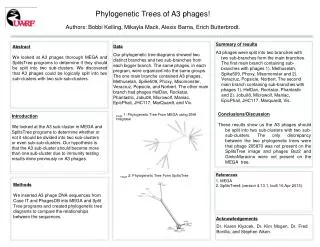
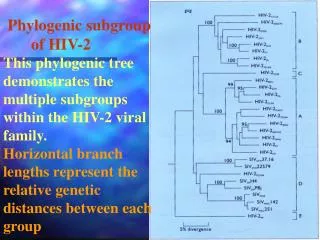
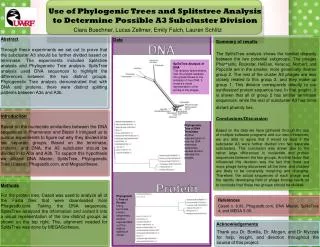
Use of Phylogenic Trees and Splitstree Analysis to Determine Possible A3 Subcluster Division Ciara Buechner, Lucas Zellmer, Emily Falch, Lauren Schlitz Abstract Through these experiments we set out to prove that the subcluster A3 should be further divided based on terminase. The experiments included Splitstree analysis and Phylogenetic Tree analysis. SplisTree analysis used DNA sequences to highlight the differences between the two distinct groups. Phylogenetic Tree analysis demonstrated that with DNA and proteins, there were distinct splitting patterns between A3a and A3b. Data DNA Summary of results The SplitsTree analysis shows the familial disparity between the two potential subgroups. The phages Phantastic, Rockstar, HelDan, Veracuz, Norbert, and Popcicle are in the smaller, more genetically diverse group 2. The rest of the cluster A3 phages are less closely related to this group 2, and they make up group 1. This division corresponds directly to our synthesized protein sequence tree. In that graphic, it is shown that all of group 2 has similar terminase sequences, while the rest of subcluster A3 has more distant phamily ties. SplitsTree Analysis of DNA This analysis demonstrates how the phages separate into groups based on the similarity of their DNA. It creates a visual representation of the sorting of the phages. Introduction Based on the nucleotide similarities between the DNA sequences in Phamerator and Blastn it intrigued us to pursue experiments to figure out why they divided into two separate groups. Based on the terminase, proteins, and DNA, the A3 subcluster should be divided in to A3a and A3b. To support this hypothesis we utilized DNA Master, SplitsTree, Phylogenetic Tree (Caseit), Phagesdb.com, and Megasoftware. Conclusions/Discussion Based on the data we have gathered through the use of multiple software programs and our own inferences, we are able to agree that it would be best if the subcluster A3 were further divided into two separate subclusters. This conclusion was drawn due to the rather large differences in nucleotide and protein sequences between the two groups. Another factor that influenced this decision was the fact that there are more phage being discovered all the time, and clusters are likely to be constantly morphing and changing. Therefore, the actual sequences of each phage and the rapidly developing field of phage biology leads us to conclude that these two groups should be divided. Phylogenetic Tree of DNA Terminase Another representation of how the DNA terminasesequences caused division amongst the phages. Protein Methods For the protein tree, Caseit was used to analyze all of the Fasta files that were downloaded from Phagesdb.com. Taking the DNA sequences, SplitsTreeanalyzed the information and sorted it into a visual representation of the tow distinct groups as shown on the top right. The, alignment needed for SplitsTree was done by MEGASoftware. Phylogenetic Tree of Protein Using terminase protein sequences, another representation of the distinct splitting is shown. References Caseit v. 6.00, Phagesdb.com, DNA Master, SplitsTree 4, and MEGA 5.05. Acknowledgements Thank you Dr. Bonilla, Dr. Mogen, and DrKlyczek for help, insight, and direction throughout the course of this project.