Download

1 / 46
550 likes | 1.39k Views
D. - Goede thermodilutie meting PiCCO 2. Goede arteriële curve. 2. Thermodilutie . Alleen standaard systemen nodig. Kalibratie 1 x per dienst (8 uur). Naar central veneuze toegang (Standaard CVD). 20 cc NaCL 0,9 van <8 o C. Injectie geleidelijk en binnen 7 sec. Arteriele toegang

E N D
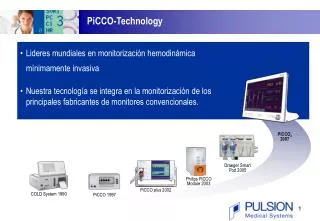
Thermodilutie Alleen standaard systemen nodig Kalibratie 1 x per dienst (8 uur) Naar central veneuze toegang (Standaard CVD) 20 cc NaCL 0,9 van <8oC Injectie geleidelijk en binnen 7 sec. Arteriele toegang (PiCCO Catheter) 3
Goede ∆T voor betrouwbare CO 36,7° 36,7° 36,8° 36,8° 36,9° 36,9° 37° 37° • Kwaliteit van thermodilutie: • Optimaal ∆T >0,3°C • Goed ∆T >0,2°C • onacceptabel ∆T <0,15°C ∆T =0,3°C • Optimaliseer de thermodilutie door: • Kouder injectaat volume • Meer injectaat volume • Kans groter bij lichaams temperatuur stijging ∆T =0,14°C
Oppervlakte onder de curve is CO Tb = Bloed temperatuur Ti = Injectaat temperatuur Vi = Injectaat volume ∫ ∆ Tb .dt = oppervlakte onder de thermodilutie kurve K = Correctie constante, opgemaakt uit specifiek gewicht en specifiek temperatuur van bloed en injectaat Stewart – Hamilton Algoritme 1940 7
GEDi Preload parameter • GEDI – Global Enddiastolic Volume Index • Als indicator voor een betrouwbare meting GEDI 680-800ml/m2
Parameter berekening Voor de calculatie van volumes… Advanced Thermodilution Curve Analysis Tb Mtt: Mean Transit time tijd wanneer helft van de indicator het punt van detectie in de arterie is gepaseerd injectie recirculatie ln Tb -1 …en… e DSt: Down Slope time exponentiëel downslope tijd van de thermodilutie kurve t MTt DSt …zijn zeer belangrijk.
Parameter berekening PBV LVEDV RAEDV RVEDV LAEDV EVLW* EVLW* ITTV = CO * MTtTDa PTV RAEDV LAEDV RVEDV LVEDV PTV = CO * DStTDa PTV GEDV = ITTV - PTV LAEDV RAEDV RVEDV LVEDV ITBV = 1.25 * GEDV EVLW = ITTV - ITBV 10
Injectaat tijd langer dan 7 sec. of wanneer TD oploopt, dan recirculatie 11
Goede constante arterie signaal Betrouwbare ∆T ≥ 0,2 maar niet ≤ 0,15 GEDi verschil < 10%, anders een derde meting. Samenvatting
Pulse Contour Analyse voor continue CO T Injection t P t • Continue gekalibreerde CO • TD CO • PiCCO-CCO is „beat to beat“ Calibration
Cardiac Output CO Hartslag Slagvolume Contractiliteit Afterload Preload • Ci • Cardiac Index (Thermodilutie) • Cci • Continue Cardiac Index (Pulse Contour) PCCI 3-5 l/min/m2SVI 40-60 ml/m2
Preload Volume GEDi Gezamelijk eind diastolische volume index GEDI 680-800ml/m2
Directe correlatie tussen GEDi en Ci CI (l/min/m2) 7.5 Frank-Starling-Curve 5.0 Inotropes 2.5 Preload increase GEDI (ml/m2) 200 400 600 800 1000 1200 1400 • GEDi vs Ci
Afterload – Resistance against which the heart must overcome to eject blood • SVRI - vaatweerstand . Pressure Flow (CO) Resistance = Vasoconstriction: Flow (CO) Pressure (RR) Vasodilatation: Flow (CO) Pressure (RR) SVRI 1700-2400 dyn/sec/m2
Contractility - Functie van de hartspier • GEF • Gezamelijk ejectie Fractie 4 x SV GEF = GEDV SV 35% Hoog contractiliteit 4,9 25% Normaal contractiliteit 3,5 15% Laag contractiliteit 1,5 GEDI 400ml 700ml 900ml GEF 25 - 35 %LVEF 50 – 70 %
Long water ELWi Enige bedside monitor voor Longwater bepalen ELWI = 19 ml/kg ELWI = 7 ml/kg ELWI 3-7 ml/kg PBW ELWI = 14 ml/kg ELWI = 8 ml/kg
EVLW, Pulmonaire Oedeem Gouden standaard =Gravimetrie Tagami T., Critical Care 2010; 14(5): R162
Hydrostatische volume verschuiving • Geef volume • Volume maximaal bereikt • Meer volume zal tot long oedeem leiden. Langeren beademingsdagen zijn hiervan het gevolg. CI 5 3 ELWI GEDI 7 3 680 800 GEDI
ScvO2- Indicates insufficient tissue oxygenation • ScvO2 – Central venous oxygen saturation • Imbalance between O2-Delivery and O2-Consumption? • Measurement via standard CVC • ScvO2 (via CVP) correlates with SvO2 (Via PA-Catheter) O2-Delivery O2-Consumption • CO • Hemoglobin • Arterial O2 saturation • Fever • Stress • Muscle work (shivering) ScvO2 ScvO2 70-80%SvO2 65-75%
Beslissings model Therapie algoritme
Beslissings model Therapie algoritme
Patient 60 jaar BP = 70/40 HR = 115 BPM CVD = 4 mmHg ScvO2 = 67% SaO2 / FiO2 = 80 (peep 16) Casus I ? • Ci = 2,6 L/min/m2 • GEDi = 900 ml/m2 (ITBVi = 1125 ml/m2) • ELWi = 22 mL/kgGEF = 26%
Patient 60 jaar Aan de CVVH voor ontwateren Na 2 uur nieuwe meting Casus IB • Ci = 6,1 L/min/m2 ???????? • GEDi = 870 mL/m2 • ∆T = 0,08OC !!!!!!!! ???????
Patient 28 jaar BP = 120/70 HR = 120 BPM CVD = 5 - 7 mmgH Temp = 38,7 Casus II • Ci = 4,7 L/min/m2 • GEDi = 620 ml/m2(ITBVi = 775 ml/m2) • ELWi = 8 mL/kg • SVV = 17% ScvO2 = 71%
Patient Kaper - 74 jaarAsma Cadialis – diastolische disfunctie BP = 250/90 HR = 108 BPM Casus IV • Ci = 1,34 L/min/m2 • GEDi = 613 ml/m2(ITBVi = 766 ml/m2) • GEF = 9% • EVLWi = 23 ml/kg • Peep 20 met FiO2 = 60
Casus IV Hydrostatisch long Oedeem (Flash Oedeem) 27-10 23:25 26-10 23:30 26-10 11:00 3,14 1,34 4,19 108 108 107 Sin 814 613 1125 130/90 130/71 127/72 1392 1370 4774 16% 9% 17% 23 7 13 +6 liter +2,5 liter 2 liter 0,1 u kg 44
Specialist en verpleegkundige Communication Plan fase Docter: onderzoek en diagnostiekDocter: Beslissing van behandeling Implementatiefase VPK: uitvoering van instructions Do Plan Evaluatiefase Docter: Follow- Up of re-evaluatie van behandeling Controlefase VPK: Succes van behandeling Act Check 45
Thermodilutie Alleen standaard systemen nodig Kalibratie 1 x per dienst (8 uur) Naar central veneuze toegang (Standaard CVD) 20 cc NaCL 0,9 van <8oC Injectie geleidelijk en binnen 7 sec. Arteriele toegang (PiCCO Catheter) 49
Thermodilutie Detection Injection • De koude injectaat passeert het hart en de longen. • CO, Preload en longwater worden gemeten.
Goede ∆T voor betrouwbare CO 36,7° 36,7° 36,8° 36,8° 36,9° 36,9° 37° 37° • Kwaliteit van thermodilutie: • Optimaal ∆T >0,3°C • Goed ∆T >0,2°C • onacceptabel ∆T <0,15°C ∆T =0,3°C • Optimaliseer de thermodilutie door: • Kouder injectaat volume • Meer injectaat volume • Kans groter bij lichaams temperatuur stijging ∆T =0,14°C
Oppervlakte onder de curve is CO Tb = Bloed temperatuur Ti = Injectaat temperatuur Vi = Injectaat volume ∫ ∆ Tb .dt = oppervlakte onder de thermodilutie kurve K = Correctie constante, opgemaakt uit specifiek gewicht en specifiek temperatuur van bloed en injectaat Stewart – Hamilton Algoritme 1940 53
Preload Volume GEDi Gezamelijk eind diastolische volume index GEDI 680-800ml/m2
Parameter berekening Voor de calculatie van volumes… Advanced Thermodilution Curve Analysis Tb Mtt: Mean Transit time tijd wanneer helft van de indicator het punt van detectie in de arterie is gepaseerd injectie recirculatie ln Tb -1 …en… e DSt: Down Slope time exponentiëel downslope tijd van de thermodilutie kurve t MTt DSt …zijn zeer belangrijk.
Goede constante arterie signaal Betrouwbare ∆T ≥ 0,2 maar niet ≤ 0,15 GEDi verschil < 10%, anders een derde meting. Samenvatting