Download
1 / 23
250 likes | 398 Views
Clustering Seasonality Patterns in the Presence of Errors. Advisor : Dr. Hsu Graduate : You-Cheng Chen Author : Mahesh Kumar Nitin R. Patel Jonathan Woo. Outline. Motivation Objective Introduction Seasonality Estimation Distance Function Experimental results

E N D
Clustering Seasonality Patterns in the Presence of Errors Advisor:Dr. Hsu Graduate:You-Cheng Chen Author:Mahesh Kumar Nitin R. Patel Jonathan Woo
Outline • Motivation • Objective • Introduction • Seasonality Estimation • Distance Function • Experimental results • Conclusions • Personal opinion
Motivation Most traditional clustering algorithms assume that the data is provided without measurement error
Objective • To present a clustering method that incorporates information contained in these error estimates and a new distance function that is based on the distribution of errors in data
Introduction • Definition of a good distance or dissimilarity function is a critical step in any distance based clustering method. • Problem:Most traditional clustering methods assume that data is without any error,but errors are natural in any data measurement. • Example:Sample average
Introduction • This study and results are focused on time-series clustering in the retail industry • This study assume that each point comes from a multidimensional Gaussian distribution
Seasonality Estimation (1/4) • Seasonality is defined as the normalized underlying • demand of a group of similar merchandize as a function of • time of the year after taking into account other factors that • impact sales such as discounts,inventory,promotions and • random effects. • Saleit=fI(Iit)*fP(Pit)*fQ(Qit)*fR(Rit)*PLCi(t-ti0)*Seasit (1) • After (1) remove the effects of all these nonseasonal factors • Saleit= PLCi(t-ti0)*Seasit
Seasonality Estimation (2/4) • S is a set of items following similar seasonality • ,therefore, S consists of items having a variety of • PLCs differing in their shape and time duration • Theorem 1:
Seasonality Estimation (3/4) • If we take the average of weekly sales of all items • in S then it would nullify the effect of PLCs as suggested • by the following equations.
Seasonality Estimation (4/4) • Seasonality values,Seast, can be estimated by appropriate • Scaling of weekly sales average, Salet The above procedure provides us with a large number of seasonal patterns, one for each set S, along with estimates of associated errors.
Distance Function(1/4) Consider two seasonalities : Ai={(xi1,σi1),(xi2, σi2),…,(xiT, σiT)} Aj={(xj2, σj2),(xj2, σj2),…,(xjT, σjT)} We define similarity between two seasonalities as follows: If the null hypothesis H0:Ai~Aj is true then similarity between Ai and Aj is the probability of accepting the hypothesis. The distance dij between Ai and Aj is defined as ( 1-similarity) which is the probability of rejecting the H0
Distance Function(2/4) Consider tth samples of both seasonalities Ait=(xit, σit) and Ajt=(xjt, σjt). (xit-xjt) ~ N( uit-ujt, (σ2it+ σ2jt)1/2 ) (1) If Ai~Aj then uit=ujt and consequently the statistic follows a t-distribution.
Distance Function(3/4) • Finally distance • Comparison with Euclidean Distance • dij is monotonically increasing with respect • to
Distance Function(4/4) • Comparison with Euclidean Distance • If all σ’s were the same and equal to σ then • it would become the rank order of (1) which • is the same as the rank order of the • Euclidean distance,(2)
Clustering • Clustering Algorithm
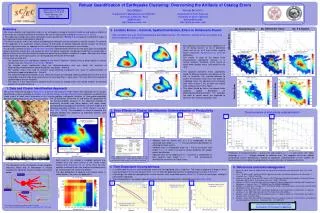
Experimental Results (1/6) Simulated Data Figure 5: Individual(prior to clustering) seasonality estimates with associated errors
Experimental Results (2/6) Figure 6:Seasonalities obtained by hError
Experimental Results (3/6) Figure 7: Seasonalities obtained by kmeans and Ward’s method using Euclidean distances
Experimental Results (4/6) • Table 1:Average # misclassifications and Average • Estimation Error for different clustering methods
Experimental Results (5/6) Table 2: Average Forecast Error (Retailer Data)
Conclusions The distance function dij is invariant under different scales for data and the clustering method obtain better cluster than others.
Personal Opinion The concept of incorporating information about errors in the distance function is very good and can be used in many other clustering applications.