Download
1 / 23
230 likes | 242 Views
Development and Application of Enhanced Light Exposure System for CREWS. Erik R. Stabenau NRC Post-doctoral Associate NOAA / AOML. Remotely sensed color. UV. CDOM. CDOM SOURCES. CDOM SINKS. INCREASED UV EXPOSURE. -Seagrasses. -Photobleaching. TEMPERATURE INCREASES. -Mangroves.

E N D
Development and Application of Enhanced Light Exposure System for CREWS Erik R. Stabenau NRC Post-doctoral Associate NOAA / AOML
Remotely sensed color UV CDOM CDOM SOURCES CDOM SINKS INCREASED UV EXPOSURE -Seagrasses -Photobleaching TEMPERATURE INCREASES -Mangroves with stratification Direct DNA Damage Direct DNA Damage Pigment Loss Pigment Loss CORAL Oxidative Stress PS II Effects/Oxidative Stress ZOOXANTHELLAE Cell Death Expulsion or Cell Death Induction of Repair Enzymes Induction of Pigment Synthesis Importance of Ocean Color CDOM controls the quality and quantity of light in shallow coastal zones Effects radiative balance • radiance reflectance ratio Effects ratio of UV-A to UV-B and PAR • Biological implications Affected by direct and indirect feedback cycles
Corals and CDOM Coral biological response to light is wavelength dependent and is influenced by other environmental stressors (Salinity, Temp.) Plan: Propagate optical properties from sensors to reefs Develop real-time algorithm to calculate diffuse attenuation coefficient (Kd) from in water and above water irradiance Interpret wavelength dependence of Kd with respect to sources of CDOM Investigate relationship of light spectra and intensity with fluorescence data or other measures of coral health Photo credits Upper: Kevin Wong, NOAA, Lower: Ray Berkelmans, Australian Institute of Marine Science/CRC Reef Research Centre
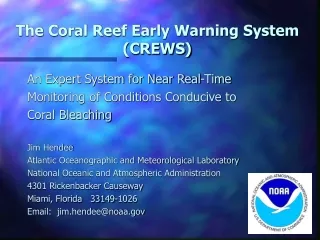
Coral Reef Early Warning System (CREWS) NetworkA CREWS Station is a "smart" environmental monitoring platform installed near coral reef areas with ‘expert’ software to produce alerts when specified environmental conditions occur (e.g., those thought to be conducive to coral bleaching) Stations provide hourly in situdata… Meteorological Data Air temperature, wind speed and direction, barometric pressure Oceanographic Data UV and PAR data, above and below water, sea temperature, salinity, pCO2, fluorometry...and information synthesis productsSurface-truth for NESDIS satellite temps coral bleaching alerts data quality alerts and environmental indicators significant to oceanographers and the public including fish & invertebrate spawning, migration, algal bloom conditions, good fishing or diving indicators. CREWS is an Internationalprogram Current Stations: Lee Stocking Island, Bahamas St. Croix, U.S. Virgin Islands 2004 Station Deployments: Puerto Rico St. Johns, U.S. Virgin Islands 2005 and beyond: Australia (1), Puerto Rico (1) Hawaii (6), American Samoa (2) Guam (1), CN Mariana Islands (2) Johnston Atoll (1), Howland/Baker (1) Palmyra/Kingman (1) Data available at www.coral.aoml.noaa.gov
Measuring Ocean Color • Light intensity decreases exponentially with Depth • Kd : Diffuse attenuation coefficient • Ed : Downwelling irradiance • z : Depth (m) Ed(z, l) = Ed(0,l) e –Kd(l) * z
Absorbance Spectra Total attenuation (c) is c = a + bb where a is the absorption and bb is the backscattering coefficients Exponential increase with decreasing wavelength • Absorption coefficient • Spectral slope coefficient
CDOM dominates absorbance in Coastal Waters Kd data from profiling compared against absorption coefficient shows that absorption by dissolved substances ~>90% attenuation Also, Biospherical and Satlantic profilers results are not statistically different
Anticipated Differential in Irradiance Observations For Current CREWS Configuration Assumptions: Nominal 1.5 m depth for in water sensor Used above water to Z = -0 m conversion based on typical type 1 water data
Results of Rigorous Kd Calculation Calculation input: • Time • location irradiance values at 305, 330, 380 nm and PAR • Depth of in water sensor Include • Reflective loss • Refraction • Ratio of diffuse to direct light • Example:Kd evaluated at 4 wavelengths for • Lee Stocking Island CREWS station (CMRC2) • on 12/4/2003 1200 hr
Results of Rigorous Kd Calculation Calculation input: • Time series • location • irradiance values at 305, 330, 380 nm and PAR • Depth of in water sensor Include • Reflective loss • Refraction • Ratio of diffuse to direct light Example:Time series for the apparent optical Property derived diffuse attenuation spectral slope Coefficient Kd(s)
Corals and CDOM Initial Results • Evaluation of CREWS configuration of optical sensors • Sensors are far enough apart to give reasonable differences in light intensity to calculate attenuation • Are the wavelengths chosen appropriate for investigating relationship between CDOM and coral health? • Performed calculation of wavelength dependence of Kd on data from LSI • Evaluate – reasonable compared to data collected in Florida Keys • Need to verify Kd with optical profiling on site • Confirm Kd(s) is function of CDOM with absorbance measurements of filtered samples from site
Corals and CDOM Continuing projects • Evaluate variations in Kd and absorption coefficient with time • Determine how much of diffuse attenuation is function of absorbance by CDOM • Explain temporal variation in values and consider limitations of irradiance to Kd conversion • Use Principal Component Analysis to identify relationships between • Kd, Kd(s), and tides – Identify sources • Kd variations with weather – Limit influence of sea surface roughness on Kd calculations • Irradiance and PAM data – link light spectra and intensity to coral health • Publish Results
Acknowledgements Coral Reef Early Warning System (CREWS) crew
Results: PCA Misleading: Graph shows relationship between Kd values and irradiance (PAR). Data has zero values in both categories at night. Needs to be parsed to eliminate bias. Question: Is there a method to do this in the available statistics software to eliminate this misleading result?
Spectral Comparison Spectral Slope Coefficient (S) • Seagrass 0.014 nm-1 • Riverine CDOM Std. 0.013 nm-1 Reported Values • Coastal 0.014 to 0.019 nm-1 • Oceanic 0.030 to 0.060 nm-1
Seagrass as CDOM Source Species: Thalassia Testinudum Experiment: CDOM flux from live or dead seagrass in natural setting Result: • Increasing absorbance indicates seagrass derived CDOM may be a source of ocean color • Similar spectral slope coefficient as terrestrial CDOM so source may have been misinterpreted
Apparent Quantum Yields for Photobleaching of Seagrass-Derived CDOM • AQY defined as change in absorption coefficient as function of moles photons absorbed and wavelength • Reduction in absorption coefficient related to • production of DIC • production of more bioavailable compounds • reduction in degree of conjugation
Initial Kd Calculation from CREWS Data Used above water to Z = -0 m conversion based on typical type 1 water data Kd
Ocean Color Colored Dissolved Organic Matter (CDOM) is Primary substance controlling ocean color • l < 500 nm • Exponential increase with decreasing wavelength CDOM is a mixture of large water-soluble organic compounds • Low Volatility • Complex & Changing Structures