Download
1 / 28
290 likes | 459 Views
UNIT 1 THE FLOW OF GENETIC INFORMATION LECTURES: 1. DNA Structure and Chemistry 2. Genomic DNA, Genes, Chromatin 3. DNA Replication, Mutation, Repair 4. RNA Structure and Transcription 5. Eukaryotic Transcriptional Regulation 6. RNA Processing

E N D
UNIT 1 THE FLOW OF GENETIC INFORMATION LECTURES: 1. DNA Structure and Chemistry 2. Genomic DNA, Genes, Chromatin 3. DNA Replication, Mutation, Repair 4. RNA Structure and Transcription 5. Eukaryotic Transcriptional Regulation 6. RNA Processing 7. Protein Synthesis and the Genetic Code 8. Protein Synthesis and Protein Processing
THE FLOW OF GENETIC INFORMATION DNA RNA PROTEIN 1 2 3 DNA 1. REPLICATION (DNA SYNTHESIS) 2. TRANSCRIPTION (RNA SYNTHESIS) 3. TRANSLATION (PROTEIN SYNTHESIS)
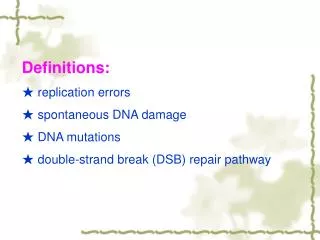
1. DNA Structure and Chemistry a). Evidence that DNA is the genetic information i). DNA transformation ii). Transgenic experiments iii). Mutation alters phenotype b). Structure of DNA i). Structure of the bases, nucleosides, and nucleotides ii). Structure of the DNA double helix 3’,5’-phosphodiester bond polarity of the polynucleotide chains hydrogen bonding of the bases specificity of base pairing complementarity of the DNA strands c). Chemistry of DNA i). Forces contributing to the stability of the double helix ii). Denaturation of DNA hyperchromicity melting curves and Tm
i) DNA transformation: in vivo experiment Mice are injected either with Type R, non-virulent Streptococcus or with heat-killed, virulent Type S cells.
Mice are injected with both Type R, non-virulent and • heat-killed, Type S Streptococcus • DNA carrying genes from the virulent, heat-killed cells transforms the non-virulent • bacterial cells, making them lethal to the mice
DNA transformation: in vitro experiment Type R cells Type R colonies Type S cells Type S colonies Type R cells + DNA from Type S cells Mixture of Type R and Type S colonies
Genotype: An organism’s genetic constitution. Phenotype: The observed characteristics of an organism, as determined by the genetic makeup (and the environment). DNA from Type S cells (thus conferring the Type S genotype) transformed Type R cells into cells having the Type S phenotype
ii). Transgenic experiments Injected into nucleus of a fertilized mouse egg Plasmid DNA carrying the growth hormone gene Egg implanted into uterus of surrogate mother mouse Mother mouse gives birth to transgenic mouse
b). Structure of DNA i). Structure of the bases, nucleosides, and nucleotides Purines Pyrimidines Adenine (A) Thymine (T) 5-Methylcytosine (5mC) Guanine (G) Cytosine (C)
Nomenclature Nucleoside Nucleotide Base +deoxyribose +phosphate Purines adenine adenosine guanine guanosine hypoxanthine inosine Pyrimidines thymine thymidine cytosine cytidine +ribose uracil uridine
ii). Structure of the DNA double helix • polynucleotide chain • 3’,5’-phosphodiester bond
hydrogen bonding of the bases A-T base pair G-C base pair Chargaff’s rule: The content of A equals the content of T, and the content of G equals the content of C in double-stranded DNA from any species
Double-stranded DNA • specificity of base pairing • complementarity of the DNA strands • B-DNA has 10 base-pairs per turn
base pairing during DNA synthesis Parental DNA strands Daughter DNA strands • base pairing during RNA synthesis
DNA that is over- or underwound is “supercoiled” • positive supercoiling results from overwinding DNA • and normally occurs during DNA replication • negative supercoiling results from underwinding DNA • and normally occurs in the nucleosome • negative supercoiling can give rise to Z-DNA • Z-DNA is a left handed helix • with zigzagged (hence Z) phosphates • Z-DNA occurs where there are • alternating pyrimidines and purines (on one strand) • the transition of B- to Z-DNA is • facilitated by 5-methylcytosine • negative supercoiling may affect RNA synthesis • by promoting Z-DNA formation • by making it easier to separate the DNA strands
5’carbon 5’ 3’ 3’carbon • antiparallel polarity of the • polynucleotide chains 3’ 5’
nucleases hydrolyze phosphodiester bonds Exonucleases cleave at terminal nucleotides. 5’ 3’ e.g., proofreading exonucleases Endonucleases cleave internally and can cut on either side of a phosphate leaving 5’ phosphate or 3’ phosphate ends depending on the particular endonuclease. e.g., restriction endonucleases 3’ 5’
c). Chemistry of DNA • i). Forces affecting the stability of the DNA double helix • hydrophobic interactions - stabilize • - hydrophobic inside and hydrophilic outside • stacking interactions - stabilize • - relatively weak but additive van der Waals forces • hydrogen bonding - stabilize • - relatively weak but additive and facilitates stacking • electrostatic interactions - destabilize • - contributed primarily by the (negative) phosphates • - affect intrastrand and interstrand interactions • - repulsion can be neutralized with positive charges • (e.g., positively charged Na+ ions or proteins)
5’ 3’ Hydrophilic phosphates Hydrophilic phosphates 3’ Hydrophobic core region 5’
Stacking interactions Charge repulsion Charge repulsion
ii). Denaturation of DNA Strand separation and formation of single-stranded random coils Double-stranded DNA Extremes in pH or high temperature A-T rich regions denature first Cooperative unwinding of the DNA strands
Electron micrograph of partially melted DNA Double-stranded, G-C rich DNA has not yet melted A-T rich region of DNA has melted into a single-stranded bubble • A-T rich regions melt first, followed by G-C rich regions
hyperchromicity Single-stranded Double-stranded Absorbance 220 260 300 The absorbance at 260 nm of a DNA solution increases when the double helix is melted into single strands.
DNA melting curve 100 50 Percent hyperchromicity 0 50 70 90 Temperature oC • Tm is the temperature at the midpoint of the transition
Tm is dependent on the G-C content of the DNA E. coli DNA, which is 50% G-C, has a Tm of 69 o C. Percent hyperchromicity 50 60 70 80 Temperature oC • average base composition (G-C content) can be • determined from the melting temperature of DNA