Download
1 / 23
230 likes | 297 Views
A comparison of the spectral evolution in WZ Sge, GW Lib, and V455 And during superoutburst phases, including analysis of outburst phases, plateau phases, and fading tails, highlighting the evolution of disk structure and emission lines.

E N D
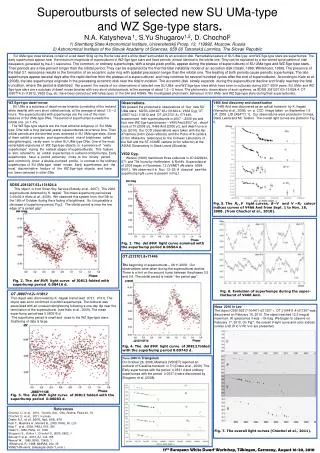
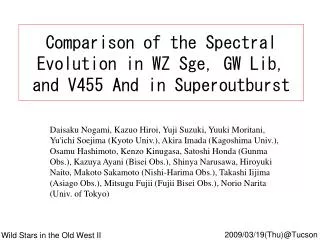
Comparison of the Spectral Evolution in WZ Sge, GW Lib, and V455 And in Superoutburst Daisaku Nogami, Kazuo Hiroi, Yuji Suzuki, Yuuki Moritani, Yu'ichi Soejima (Kyoto Univ.), Akira Imada (Kagoshima Univ.), Osamu Hashimoto, Kenzo Kinugasa, Satoshi Honda (Gunma Obs.), Kazuya Ayani (Bisei Obs.), Shinya Narusawa, Hiroyuki Naito, Makoto Sakamoto (Nishi-Harima Obs.), Takashi Iijima (Asiago Obs.), Mitsugu Fujii (Fujii Bisei Obs.), Norio Narita (Univ. of Tokyo) 2009/03/19(Thu)@Tucson Wild Stars in the Old West II
At first… We presented a talk in the 8th Pacific Rim conference on Stellar Astrophysics in May, 2008, based on the same data. And, we have to apologize for the participants, and those who have read our contribution in the proceeding book (astro-ph/0807.2098).
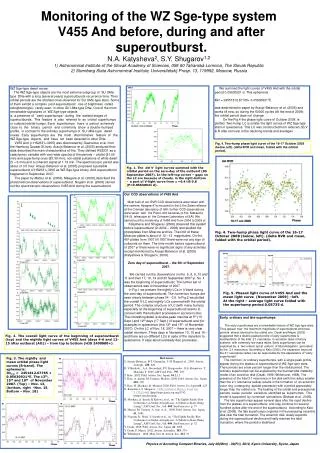
4. Evolution of the disk in the course of the outburst Rising phase wind GW Lib flaring disk quiescence V455 And PLEASE FORGET THIS! Outburst maximum Plateau phase Temperature inversion layer?
WZ Sge during the 2001 SOB Baba et al. (2002), Nogami et al. (2004)
Rising phase: Balmer & He I in absorption He II Maximum: Ha, He II, CIII/NIII double-peaked emission lines, other Balmer lines in absorption Halpha Spiral structure Early superhumps?
~1 week after the maximum: still double-peaked emission lines of Ha, He II, CIII/NIII At the end of the plateau phase: strong double-peaked emission lines of the Balmer series.
Light curve of GW Lib during the 2007 superoutburst Fading tail, still brighter than by 1-2 mag in quiescence Plateau phase ~8.5 mag 27 days Hiroi et al., PASJ, submitted
The first spectrum during the rising Blue continuum + Balmer absorption
: pure absorption lines FWHM ~3000km/s The same spectrum, but normalized at the continuum level
: absorption + emission core (FWZI<20Å) High excitation lines: He II, CIII/NIII, CIV? Normalized spectrum at the very maximum
emission core of high excitation lines the other Balmer absorptions became strong. At the fading tail after the rapid decline During the outburst plateau phase Balmer emission lines
No significant detection! Rapid variability? Nearly pole-on At the maximum During the plateau
5 night obs. During the fading tail V455 And: Outburst light curve and Observation date ~7.8mag Mid- to high-resolution time-resolved spectra ~28days
near maximum R~600 Blue continuum + Single-peak emission lines of the Balmer series, and He I + Strong He II R~600
Short-term variabilities in the emission-line profile just after the maximum He II 4686 Orbital phase • Halpha: single peak, He II 4686: double peak (Peak sep. ~300 km/s ) • No prominent radial velocity variation? • The shape was slightly changing, but not periodic on the orbital period.
Doppler maps of Balmer & He II lines • Swell concentrated around Vx,y~0, • in Halpha, beta • Depression on a swell around Vx,y~0, • in He II, Hgamma • Not reliable
Spectral evolution during the plateau phase 2007/09/05(before the max) • Gettinging weaker • Becoming double-peaked • Peak separation <1000 km/s 2007/09/06(at the maximum) 2007/09/12 2007/09/19 6000 7000 4500 5000 6500 5500
Spectra during the fading tail Around max. Near the end of the plateau • Balmer emission lines and He I lines became strong with time. • No sign of highly excited lines. Fading tail
Spectral evolution I • Before the maximum: Balmer absorption lines (all) • Around the maximum: Ha, He I&II, CIII/NIII emission line (all) double peak (WZ Sge, spiral st.) single peak (V455 And?, GW Lib) Hb,g,.. absorption (WZ Sge, GW Lib) single-peaked emission (V455 And)
Spectral evolution II • During the plateau phase: He II, CIII/NIII soon getting weaker (all) Ha slightly getting weaker (WZ Sge) + double-peaked (V455 And) getting weaker to absorption (GW Lib) Hb,g,.. absorption to emission (WZ Sge) continuously emission (V455 And) continuously absorption (GW Lib) • During the fading tail: similar to quiescence (all)
Evolution of the disk in the course of the outburst GW Lib Optically thick disk Rising phase quiescence WZ Sge, V455 And Fading tail Outburst maximum Plateau phase Disk + P.I. are settled down. Geometrical effect? (emi. vs abs.) Flaring disk + photo ionization emission lines
The next CV meeting will be held at Kyoto, Japanin July 2010! おいでやす、京都へ。 Contact: Daisaku Nogami (nogami@kwasan.kyoto-u.ac.jp)