Download
1 / 15
150 likes | 286 Views
Temporal and spectral evolution of Gamma-Ray Bursts. Effects of the surrounding environment. Alessandra Galli 1,2 & Luigi Piro 2. 1 Department of physics, University “La Sapienza”, Rome, Italy 2 IASF, CNR-INAF, Rome, Italy.

E N D
Temporal and spectral evolution of Gamma-Ray Bursts. Effects of the surrounding environment. Alessandra Galli1,2 & Luigi Piro2 1Department of physics, University “La Sapienza”, Rome, Italy 2IASF, CNR-INAF, Rome, Italy XXXXth Rencontres de Moriond, Very High Energy Phenomena in the Universe 12-19 March, 2005
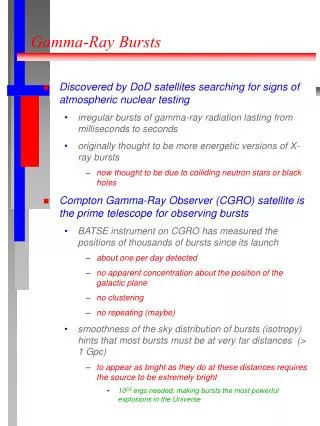
The observations suggest that GRBs are produced by massive stars (metal emission and absorption lines, GRB localization near the centre of the host galaxy, GRB-Supernova connection) Theoretical models The collapsar model (Woosley 1993, Ramirez-Ruiz et al. 2002, Waxman& Meszaros 2003) predicts that the GRB is produced by a massive star that loses mass in the form of a wind. The medium around the central engine has a wind densityprofile: n~r-2 Instead, GRB afterglow studies show that in the most of the events the afterglow light curves are explained in a uniform interstellar medium (Panaiterscu & Kumar 2001, 2002, Yost et al. 2003) Can we explain light curves and at the same time solve the discrepancy ?
The case of GRB011121 General characteristics Long duration event, 75 s in the GRBM and 120 s in the WFC (Piro et al. 2004) Presence of a fainter event (precursor) starting about 30 s before the main event (Piro et al. 2004) X-ray late burst or reburst occuring about 240 s after the main pulse (Piro et al. 2004) z=0.36 (Infante et al. 2001) Piro et al. 2004 Piro et al. (2004) found that in this event: Precursor spectrum softer than the main pulse Reburst spectrum softer than the preceding main pulse and consistent with the afterglow spectrum at 1 day X-ray and optical data compatible only with a fireball expanding in a wind Is possible explain the reburst? What is its origin?
Results The light curve from the decay part of the reburst to the afterglow is well REPRODUCED BY A POWERLAW IF THE ORIGIN OF THE TIME t0 IS SHIFTED TO THE ONSET OF THE REBURST: t0=(240±10) s. The calculated light curve fits the data only if the fireball interacts with a WIND PROFILE ENVIRONMENT THE FIRST EVIDENCE SUGGEST THAT THE REBURST IS THE BEGINNING OF THE AFTERGLOW EMISSION (talk of Piro L.) E53=0.28, 130, A*=0.003, e=0.01, B=0.5, p=2.5, t0=250 s
The case of XRF011030 General characteristics No counterpart in the GRBM (Gandolfi 2001) Duration of about 1100 s Preceded by a fainter event about 250 s long X-ray source without optical counterpart (Harrison et al. 2001) 0.6 ≤ z ≤ 3.5 (Bloom et al. 2003) Temporal Analysis The light curve of XRF011030 is characterized by the presence of a precursor preceding the main pulse, and by the presence of a X-ray late burst or reburst, a sudden emission occuring about 1300 s after the main pulse and 200 s long. Instead a break occurs between 104 and 106 s after the main pulse.
Spectral Analysis Total event spectrum, preceding faint event and reburst included: powerlaw with photon index .84+0.17-0.16 Preceding faint event: a powerlaw steeper than the main event (Tab.1). Other possibility: a black body model (in agreement with collapsar model expectation, Tab.2). Reburst spectrum: softer than the main pulse; its spectrum is consistent with the one of the afterglow (powerlaw, Tab. 1). -Energy range: 2-26 keV Tab.2: Fit with the black body model Tab.1: Fit with the powerlaw model (*) Results of analysis performed by D’Alessio & Piro (2005)
Results This event has characteristics similar to those of GRB011121 We decided to apply the same interpretation on XRF011030 We shifted the origin of the time t0 to the onset of the reburst, and we found that considering a fireball expanding in a wind the calculated light curve fits the data, while for an ism it does not. WIND: DOES WORK ISM: DOES NOT WORK E53=0.0315, =45, A*=0.005, =0.03, =0.0089, p=2.2, t0=1300 s. E53=0.0315, 0=45, A*=0.005,e=0.03, eB=0.0089, p=2.2, t0=1000 s.
Theoretical ground The onset of the external shock depends on the thickness of the fireball.A shell is thin if Δ<(E/nmpc2)1/3Г0-8/3 (Sari & Piran1999). In this case the reverse shock ends crossing the shell before the fireball reaches the deceleration radius r0. The origin of the time t0 is equal to the beginnig of the prompt emission while the onset of the afterglows coincides with deceleration time. Therefore, the results of our data analysis and those of our theoretical analysis seems to FAVOUR the case of a fireball with a THICK SHELL. The shell is energized until greater times, and the reburst is produced by the shock of the latest layers of the shell and the external medium. We analized also the case of a fireball with a thin shell: STANDARD MODEL: DOES NOT WORK! It is based on a sperical fireball with a thin shell. MODELS WITH A DISCONTINUOUS DENSITY PROFILE: DOES NOT WORK! It is supported by the work of Chevalier, Li & Fransson 2004. When the fireball interacts with a discontinuity a greater number of photons are produced. But, during the deceleration phase the emission is depending poorly on the density profile of the medium.
The interpretation of the break • Break of spectral nature F-(p -1)/2, F t-(3p – 2)/4obs< c c t1/2 F-p/2 , F t-(3p - 1)/4c < obs p = spectral index of electrons population We assumed p=2.2 because it is consistent with the spectral analysis (Tab.1), but the temporal decay of the calculated light curve is not in agreement with the two CHANDRA observations: theo and obs(D'Alessio & Piro 2005) • Break of dynamic nature: the jet model > -1same evolution of a fireball with spherical simmetry < -1 the sideways spread of the jet becomes important, the flux decreases faster F t-p c< obs, c > obs (Sari, Piran & Halpern 1999) With p=2.2 the temporal decay is in agreement with the two CHANDRA observations. THE EVENT IS POSSIBLE BETTER EXPLAINED BY A JET FIREBALL EXPANDING IN A WIND
Conclusions • The light curves of XRF011030 and GRB011121 can be described only by a fireball with a thick shell. • If the fireball has a thick shell the onset of afterglow emission is shifted to the instant of the reburst. This suggest that the reburst represents the beginning of afterglow emission. • We confirm the claim by Piro et al. (2004) on GRB011121. • For XRF011030 we found a new case in which the event light curveis explained by a wind profile environment.
THE STANDARD FIREBALL MODEL GRB011121 WIND ISM E53=0.28, , A*=0.003, e=0.03, B=0.05, p=2.5. E53=0.28, , n=1, e=0.03, B=0.05, p=2.5.
THE STANDARD FIREBALL MODEL XRF011030 WIND ISM E53=0.315, , n=1, e=0.03, B=0.05, p=2.2. E53=0.0815, , A*=0.01, e=0.03, B=0.05, p=2.2.
MODELS WITH A DISCONTINUOUS DENSITY PROFILE XRF011030 REGION 1: WIND, REGION 2: ISM E53=0.315, , A*=0.01 (region1), n=5 (region 2), rdisc=6·1016 cm, e=0.03, B=0.05, p=2.2.
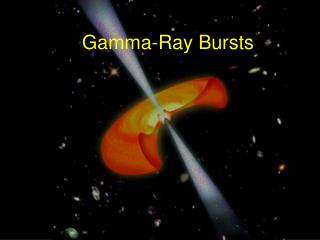
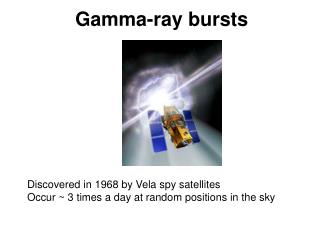
The main question in gamma-ray burst research is: Who is the progenitor ? The observations of GRB afterglows shown that the bursts with an optical counterpart are localized in the stars formation regions of far galaxies, and that the energy released is between 1051 and 1054 erg if the emission has spherical symmetry. Two families of progenitor could produce events of such energy: 1. Merging of two compact objects (Fryer , Woosley & Hartmann 1999) 2. Collapse of a massive star (Woosley 1993, Vietri & Stella 1998)
Observations Fe emission and absorption lines in the spectrum of the main event and in those of X-ray afterglow (Piro et al. 1999, Antonelli et al. 2000). In some events were detected also Mg, Si, S and Ar lines (e.g. Reeves et al. 2002) The counterparts of the most of the events are localized near the centre of the host galaxy (Bloom et al. 2002) The optical light curves of some GRBs have components similar to those of a supernova. The most famous case are GRB980425 (Galama, Vreeswijk et al. 1998), GRB030329 (Stanek et al. 2003, Hjorth et al. 2003) and GRB031203 (Malesani et al. 2004) The value of the column density of Hydrogen on the line of sight of the observer is consistent with the typical value of star formation regions in our galaxy (NH~1021÷22 cm-2) The observations suggest that GRBs are produced by massive stars